If you want to analyze trading performance properly, start with more than P&L. Review the setup, the market condition, the execution, and the behaviour behind the trade. Otherwise you are just staring at numbers and calling it insight. Bit ambitious, that.
A good trading journal helps you track all of that in one place. Daily review catches fresh mistakes. Weekly review catches patterns. Monthly review tells you whether your edge is real, fading, or was mostly wishful thinking with candles.
This guide will show you how to analyze trading performance with a journal, what to track, what to review, and which behavioural leaks usually hurt traders more than the setup itself.
How to Analyze Trading Performance Properly

Most traders try to analyze performance by checking one thing only: profit. That is useful, but incomplete. A winning trade can still be badly executed. A losing trade can still be clean. That process-first point shows up clearly in this recent Investopedia piece on reviewing trades, and honestly it matters more than most traders want to admit.
So the simple framework is this:
- Review process before outcome.
- Separate daily, weekly, and monthly review.
- Track behaviour, not only metrics.
- Change rules only after repeated evidence, not one dramatic afternoon.
Step 1: Review Process Before Outcome
Ask four things first:
- Was the market condition right for this setup?
- Did I follow my rules before entry?
- Did I manage the trade the way I planned?
- Did I do anything emotional after entry?
That order matters. If you skip straight to profit, you will keep praising lucky trades and defending sloppy behaviour. Traders do this all the time. The market does not complain. It just sends the invoice later.
2. Daily Review
Your daily review is for fresh mistakes. Short. Honest. No drama.
After the session, write down:
- What trades did I take and why?
- Did I follow the plan or improvise because the candle looked exciting?
- Did I enter late, exit early, move stops, or size badly?
- Was I calm, rushed, bored, angry, or trying to win back money?
Daily review is where you catch revenge trades, FOMO entries, hesitation, and those lovely “just this one time” decisions. Usually it was not just one time.
3. Weekly Review
Weekly review is where single mistakes turn into visible patterns.
Look across the week and ask:
- Which setup actually worked?
- Which setup looked smart but kept draining money?
- Did I trade better on some days, sessions, or market conditions?
- Which mistake repeated more than once?
If one setup wins only when the market is clean and trends hard, good. That is useful information. If it dies every time price starts chopping around, also useful. This is how trading performance analysis becomes practical instead of motivational wallpaper.
You do not need an hour for this. Here is the whole weekly review done in 20 minutes flat:
Scan the dashboard
Week's P&L, win rate, and drawdown at a glance.
Filter by setup
Which setup carried the week, which one bled it.
Filter by time, day, symbol
Find the session or ticker doing most of the damage.
Write one action item
One change for next week. Not five. One.
4. Monthly Review
Monthly review is the performance audit. This is where you stop talking like a hopeful trader and start looking like a small business owner.
Review the bigger numbers:
- Win rate
- Average win vs average loss
- Drawdown
- Setup-wise performance
- Rule breaks
- Time-of-day or market-condition performance
Win rate alone is not enough. A strategy can win often and still be useless. A lower win rate can still work if the average win is strong and the execution is disciplined. Confidence should come from evidence. Otherwise it is just hope wearing a clean shirt.
Metrics That Matter: Formulas and Benchmarks
Naming a metric is not the same as knowing what to do with it. These five cover most of what the monthly review needs, with the formula and a benchmark range to judge yourself against — not to hit exactly, but to know which side of "fine" and "fix this" you are on.
| Metric | Formula | Benchmark |
|---|---|---|
| Win rate | Winning trades ÷ total trades × 100 | 40-60% is typical for a disciplined day or swing trader. Lower is fine if the average win is big enough to cover it. |
| Profit factor | Gross profit ÷ gross loss | Above 1.3 is solid, above 1.5 is strong. Below 1.0 means the strategy is losing money regardless of win rate. |
| Max drawdown | (Peak equity − trough equity) ÷ peak equity × 100 | Keep it under 15% of account equity. Past that, both the account and your discipline start struggling to recover. |
| Expectancy | (Win rate × Avg win) − (Loss rate × Avg loss) | Must stay positive. The exact number matters less than it holding above zero as your sample grows. |
| Average R-Multiple | Avg trade P&L ÷ initial risk (R) | Above 0.2R on average is a working edge. It puts every trade on the same scale regardless of position size, so a setup traded at different sizes still compares fairly against itself. |
Win rate and profit factor answer different questions, so track both. A 35% win rate with a 3:1 average win-to-loss ratio can out-earn a 65% win rate that bleeds small losses in between. Neither number means much without the other.
Expectancy is the one that actually answers "is this worth doing." It blends win rate and average win/loss into a single per-trade number: how much you can expect to make, on average, every time you take this setup. A number on its own does not make that click, so here is the same formula worked through on 10 trades.
10 trades: 6 wins averaging ₹1,500, 4 losses averaging ₹800
Win side
60% × ₹1,500
= ₹900 expected gain
Loss side
40% × ₹800
= ₹320 expected loss
Same setup, same win rate, different average loss, and that ₹580 can turn negative fast. That is why expectancy matters more than win rate alone. If you want to go a layer deeper, some traders also track the Calmar ratio (return ÷ max drawdown) to weigh returns against pain — worth knowing exists, not worth obsessing over before the five numbers above are solid.
Filter Your Data: Setup, Time, Day, Symbol, and Holding Time
A single blended win rate hides more than it reveals. The monthly numbers above are only the start — filter them by:
- Setup — which specific setup is actually profitable, and which one just feels familiar.
- Time of day — the open often behaves nothing like the last hour of the session.
- Day of week — some strategies quietly depend on volatility that only shows up on certain days.
- Ticker or symbol — a setup that prints money on one instrument can be flat or negative on another. Blending them together hides which symbols are actually worth your screen time.
- Holding time — split trades held minutes from trades held hours or days. A setup often has one holding window where it works and a longer or shorter one where it just bleeds time and fees.
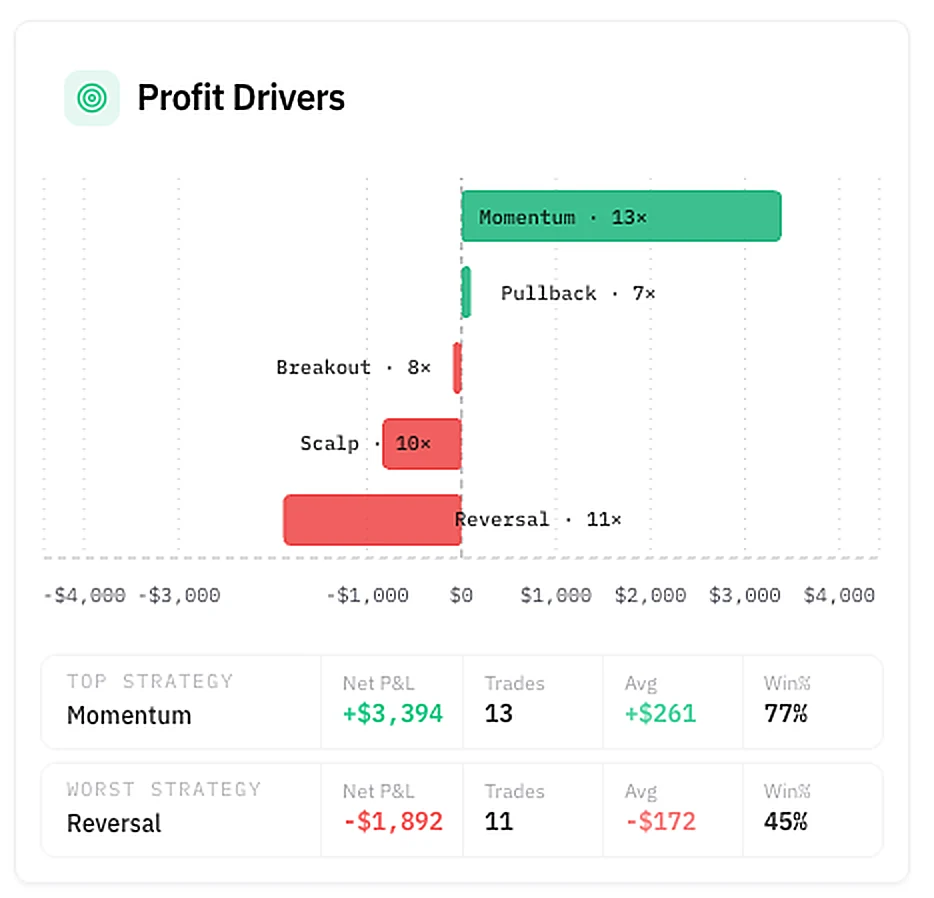
This is the step most traders skip, and it is usually where the real edge is hiding — or where it turns out there isn't one. One profitable setup buried inside three losing ones still nets out as "meh" until you split them apart. This is what that looks like once it is broken out by setup instead of blended into one number:
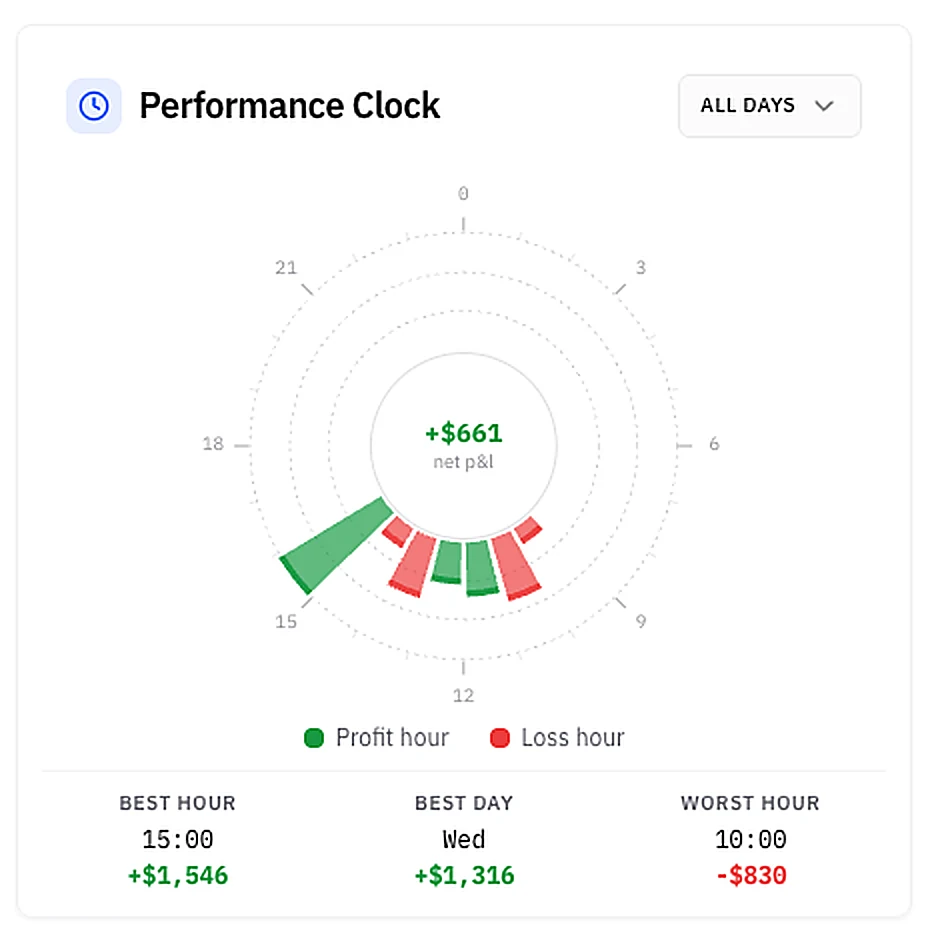
The same logic applies to time. Splitting P&L by hour and day of week usually surfaces one uncomfortable pattern: a session or two doing most of the damage while the rest of the week looks fine.
A single win rate also flattens time. It tells you where you ended up, not how you got there — and a strategy that is fading needs a different response than one that is holding steady. Rolling win rate fixes that: recalculate it every 20 trades instead of once for the whole history, and a slide shows up while it is still small.
Rolling win rate, last 60 trades
One guardrail before you act on any of this: don't judge a setup off five or ten trades. A short losing streak on a good setup and a short winning streak on a bad one look identical in a small sample — which is exactly why the chart above uses windows of 20, not 5. Give it enough trades before deciding whether to keep a setup, retire it, or size it up.
Common Mistakes When Reviewing Performance
Most of the damage in a monthly review does not come from bad math. It comes from a handful of habits that feel reasonable in the moment and quietly wreck the conclusion.
- Judging a strategy by P&L alone. A green month with sloppy execution teaches you nothing except that you got lucky. Go back to process before outcome, the same rule that opened this guide.
- Chasing win rate. A high win rate sitting next to a weak profit factor is a slow leak wearing a confident number. Check both, every time, not just the one that flatters you.
- Only reviewing the losses. Winners deserve the same scrutiny. A lucky win that goes unreviewed has a way of becoming an unlucky habit two months later.
- Rebuilding the whole system after one bad week. That is precisely what daily, weekly, and monthly review are supposed to prevent — one rough stretch is data, not a verdict.
- Benchmarking against someone else's screenshot. Different account size, different risk, different market. Your only useful comparison is your own numbers from last month.
Behavioral Analysis: The Part Most Traders Skip
This is where a trading journal becomes more useful than plain broker history. Broker history shows what happened. A journal shows why it happened.
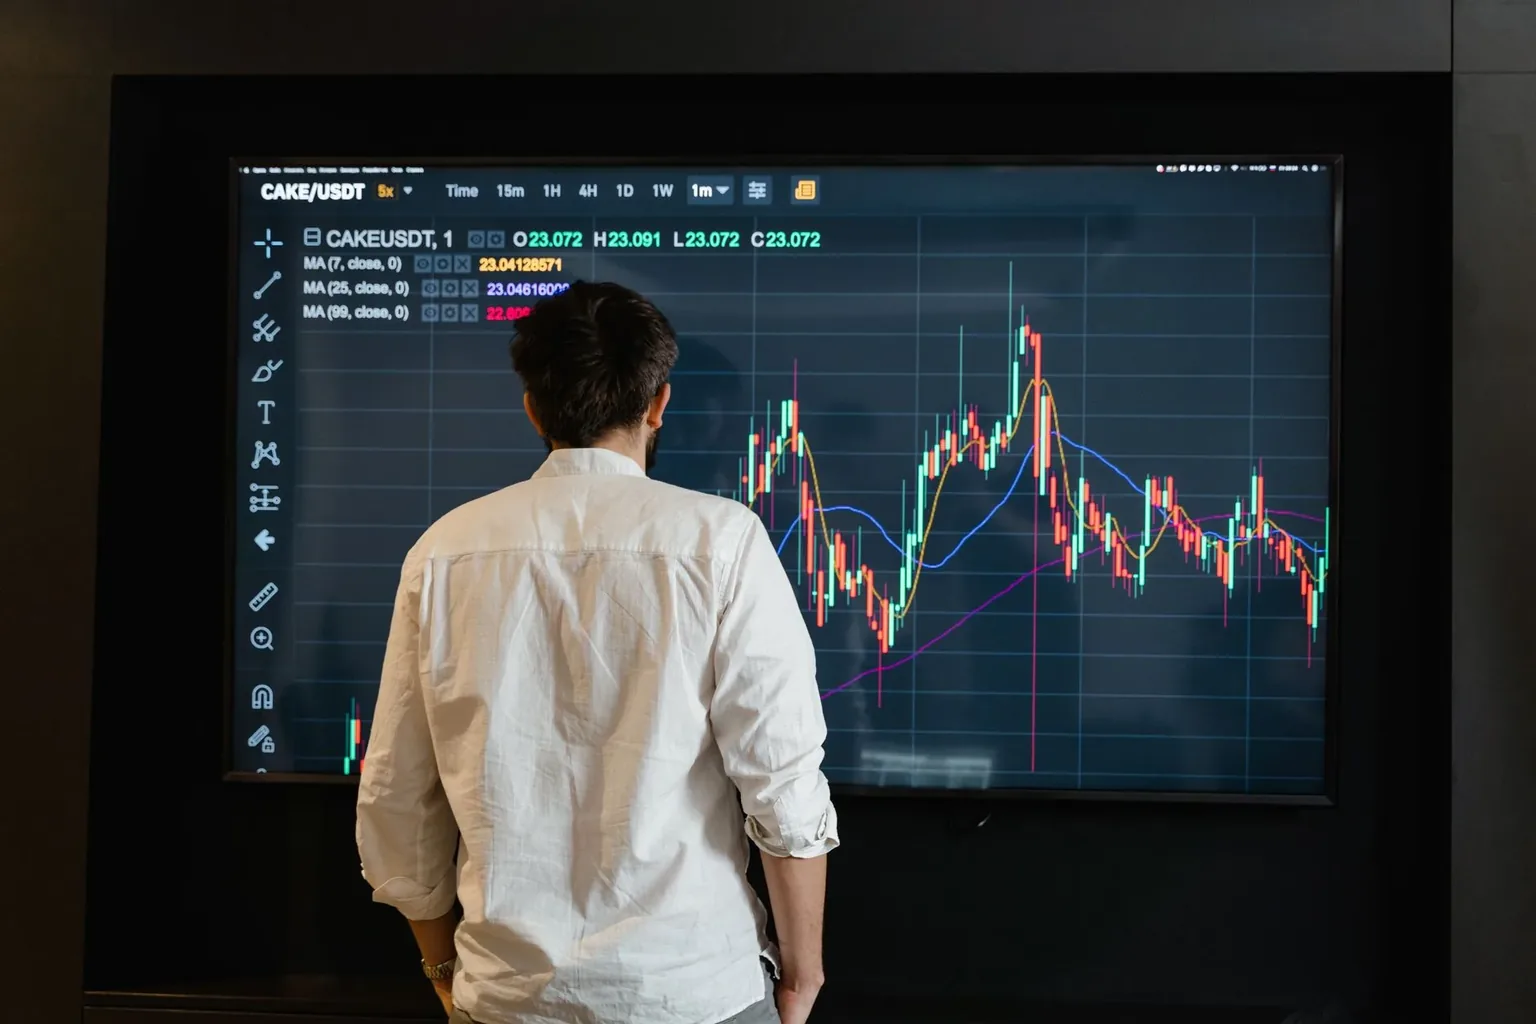
One of the clearest lessons I learned came from reviewing my own Nasdaq trades on second-based charts. On paper, the idea looked fast and clever. In the journal screenshots, it looked like me rushing entries and forcing execution. The 2-minute chart suited me far better. Painful little discovery. Still cheaper than repeating the same mistake for another six months.
That is why behavioural analysis matters. You are not only reviewing the setup. You are reviewing yourself inside the setup.
- Do you enter late because you need extra confirmation?
- Do you cut winners because unrealized profit makes you nervous?
- Do you widen stops because “it might come back”?
- Do you overtrade after one loss because panic suddenly feels productive?
This is how you improve trading results faster. Not by collecting five more indicators. Usually by catching one stubborn habit and finally stopping it.
What to Track if You Want Better Trading Performance
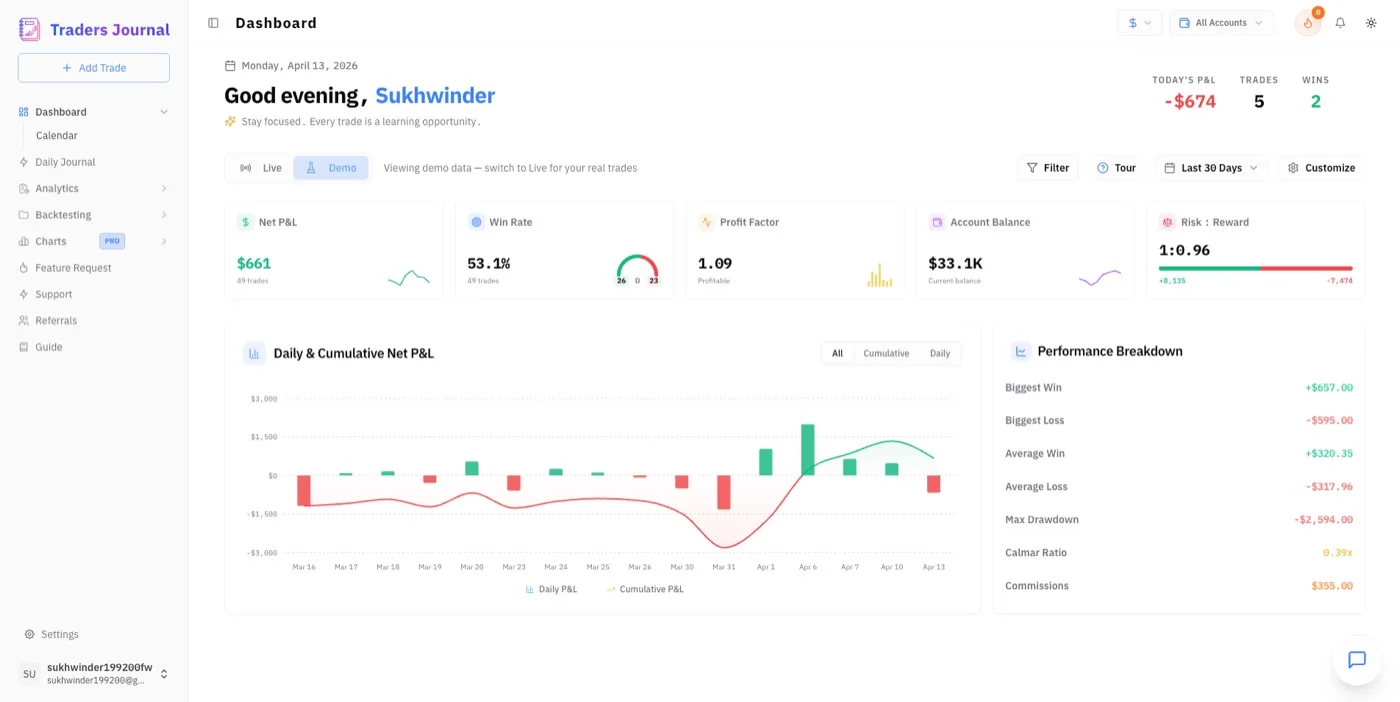
If you want to track trading performance properly, keep the journal simple but complete. Three stages are enough.
Pre-Trade: The Plan
This is the stage most traders skip fastest, and the research is not forgiving about it. NYU psychology professor Peter Gollwitzer spent years studying why some people follow through on a plan and others abandon it mid-decision, publishing his results in American Psychologist. His finding is one of the most replicated results in behavioural psychology: people who write a specific "if this happens, I will do that" plan before acting follow through far more often than people who simply intend to be disciplined. A plan held in your head is an intention. A plan written in the journal, before entry, is something closer to a commitment — and only one of those tends to survive contact with a moving chart.
Before entry, track:
- Market bias — your actual read on direction, written down before the trade proves you right or wrong. Skip this and hindsight quietly rewrites what you "always thought" was going to happen.
- Setup or checklist name — the tag that makes every setup-by-setup breakdown possible later, including the Profit Drivers view further up. No tag at entry means no breakdown afterward, no matter how good your memory is.
- Expected risk-to-reward — the number you compare against what actually happened. The gap between planned and actual R:R is usually where edge quietly leaks out, one moved stop at a time.
- Market condition — trending, ranging, volatile, or quiet. This is the second filter, alongside setup, that explains why the same idea wins in one month and loses in the next.
- Why the trade exists at all — one written sentence. This single field catches more "I don't actually know why I took this" trades than anything else on the list.
- Screenshot before entry — proof outlasts memory. Six months from now you will not recall what the setup actually looked like, only a slightly flattering version of it.
This part answers a brutal but useful question later: did you actually have a plan, or did you just have a strong feeling with nice candles around it?
During Trade: Execution
UC Berkeley finance professor Terrance Odean studied the actual trading records of close to ten thousand brokerage accounts and published the results in The Journal of Finance. The pattern held trade after trade: investors sold their winners too early and held their losers too long, almost like clockwork. Not carelessness — in the moment, locking in a small win feels good, and closing a small loss feels like admitting failure, even when the numbers say the opposite. Execution tracking exists to catch you doing exactly this, in your own account, on your own trades.
While the trade is live, track:
- Entry and exit price — the raw input every number in the metrics table above is built from. Win rate, profit factor, expectancy, drawdown — none of it works without this logged accurately.
- Stop loss and target — the planned exit versus the actual one. This is how you tell a loss that was "the trade doing its job" apart from a loss that was "the plan not being allowed to work."
- Position size — the multiplier that turns a win rate into real money. Two traders with an identical win rate can post opposite results depending on whether size stayed consistent or crept up after a good week.
- Time in and time out — the raw data behind every time-of-day and day-of-week breakdown, including the Performance Clock a few sections up. No timestamp, no chart.
- Fees or commissions — small on one trade, quietly decisive across a hundred. On high-frequency setups, this line alone can turn a "profitable" strategy into a break-even one.
- Rule changes made after entry — the field that separates "the strategy failed" from "I broke the plan while it was live." Barber and Odean, also at Berkeley, tracked 66,465 brokerage households over six years and found the ones who traded most actively earned 11.4% a year while the market they were trading in returned 17.9% — the intervening itself, not the underlying picks, was the expense eating the return. Sitting on your hands is a skill. This line is where you find out if you have it.
This is where you see whether the performance problem came from the strategy or the execution. Very often, it is the second one pretending to be the first.
Post-Trade: Reflection
The strongest evidence for this stage does not even come from finance. A Kaiser Permanente-led study of 1,685 adults trying to lose weight found that the single biggest predictor of success was not the diet plan or the gym membership. It was whether they wrote down what they ate every day. People who kept a daily record lost an average of 8.2 kg, more than double the 3.7 kg lost by those who rarely tracked — on the same diet. Writing it down was not paperwork. It was the mechanism. A trading journal works the same way: the review only compounds if the reflection gets written, not just felt.
After exit, track:
- Was the trade according to plan? — a direct check against every field from the pre-trade plan. This is the line where "I had a plan" gets tested against "I actually followed it."
- What emotion showed up most? — the raw material behind the entire behavioural analysis section further down. One tagged emotion is a data point. Twenty tagged emotions are a pattern.
- What mistake happened, if any? — the log that becomes the "repeated mistake" your weekly review is supposed to catch. A mistake seen once is bad luck. Seen four times in a journal, it has a name.
- What should be repeated next time? — the field most journals skip entirely, and the one that keeps the process from turning purely punitive. Good decisions need reinforcing as much as bad ones need catching.
- Screenshot after exit — paired with the before-entry screenshot, this is the closest thing to watching the trade back afterward. Plans are easy to misremember. Two screenshots side by side are not.
That final note matters more than traders think. If every trade ends with a clear lesson, your review process compounds. If every trade ends with “market bad,” progress stays suspiciously slow.
How This Looks Inside Traders Journal
Log the plan
Bias, setup, risk-to-reward, and a screenshot — filled in manually before entry, not reconstructed from memory afterward.
Execute
Entry, exit, stop, size, and timing tracked as the trade actually plays out — the raw data every metric above is built from.
Close and review
Add the exit screenshot and see it beside the entry one — proof of what actually happened, not a flattering memory of it.
Reflect
A daily journal questionnaire captures what was actually going on in your head — and feeds straight into the Performance Clock and Profit Drivers views above.
Plan, execute, review, reflect — that loop is the entire framework this guide just walked through, running automatically instead of living across a notebook, a broker export, and whatever your memory kept. If you want to see it in your own account, Traders Journal runs that exact flow end to end. If you want to compare tools first, our best free trading journal software guide is a good next stop.
Final Thought
Learning how to analyze trading performance is mostly learning how to stop lying to yourself. Not in a dramatic, sit-down-and-confess way — in a small, boring, "let me actually look at the number" way.
You now have the full picture: what to track, what the numbers actually mean, how to split them by setup and time before they mislead you, and the handful of mistakes that quietly wreck a good review. None of this is complicated. Most of it is just easy to skip, because writing down a mistake stings more than forgetting it. It shouldn't. Forgetting it just means you get to make the same one again next month, for free.
You do not need a perfect system on day one. Review one week properly before promising yourself a flawless journal forever. The trades you have already taken are not going anywhere — they are sitting in your history right now, waiting to tell you something useful, if you actually look.
If a trade was worth taking, it is worth reviewing properly.
That is really the whole idea.