Type "portfolio backtesting" into Google and almost every result hands you a calculator — plug in some ETF tickers, pick a rebalancing frequency, and it spits out a CAGR and a drawdown chart from 1994. Useful, if you are building a retirement portfolio. Not so useful if you are an active trader running three strategies across options, futures, and swing setups who actually wants to know what happens when you run them together.
That is the gap this guide fills. We will define portfolio backtesting properly, separate the asset-allocation version from the active-trader version, walk through how to test your full trading portfolio without writing a line of code, and cover the metrics and mistakes that only show up once you stop looking at strategies one at a time.
What Is Portfolio Backtesting? (Short Answer)
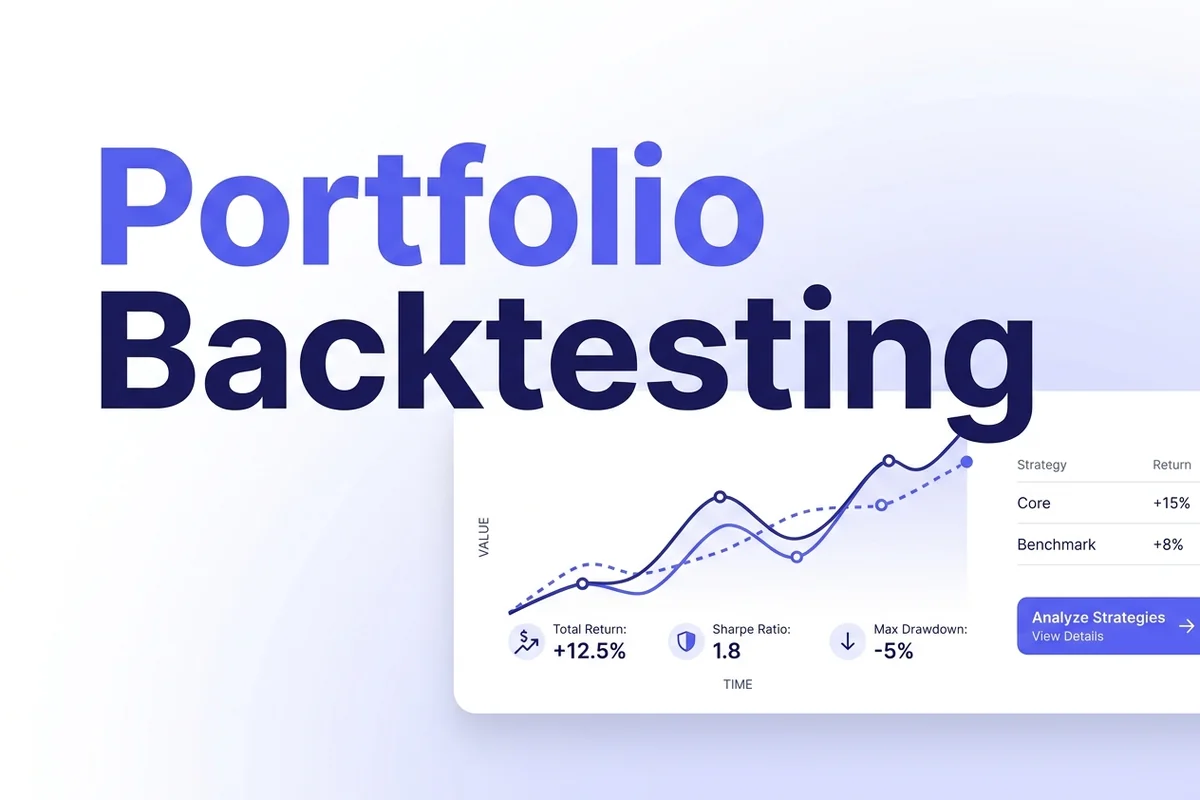
Portfolio backtesting is testing how a group of positions or strategies would have performed together against historical data, instead of testing one trade idea on its own.
The word "portfolio" is doing the work here. A single-strategy backtest answers: does this one set of rules have an edge? A portfolio backtest answers a bigger question: what happens to my results, my drawdown, and my stress levels when I run several of these at the same time? If you want the basics of single-strategy testing first, see what backtesting actually is.
Every strategy can be tested. Not every strategy is profitable, and not every combination of profitable strategies is a good portfolio. Two strategies that both bleed money in the same choppy week are not diversification — they are the same risk wearing two different names.
Two Very Different Things Called "Portfolio Backtesting"
Search results blur these together, so let's split them properly.
1. Asset-Allocation Backtesting
You pick a handful of ETFs or funds, set percentages (60% stocks, 40% bonds, for example), and simulate how that mix would have grown over decades with dividends reinvested. This is what most "portfolio backtester" tools online actually do. It answers a long-term investing question, not a trading one.
2. Multi-Strategy Portfolio Backtesting
You run several active trading strategies — an index options basket, a swing equity setup, a futures breakout system — and test how they behave as a group. Combined equity curve. Combined drawdown. Do they lose on the same days, or different ones?
Most retail trading tools are built for exactly one strategy on one chart at a time. That leaves active traders with a real gap: they can backtest each piece, but nothing shows them the whole picture without manual work. This guide is about closing that gap.
| Asset-allocation backtesting | Multi-strategy backtesting | |
|---|---|---|
| Who it's for | Long-term, passive investors | Active traders running several strategies |
| What goes in | ETF/fund tickers and target percentages | Fixed entry, stop, and target rules per strategy |
| Rebalancing | Scheduled (monthly, quarterly, annually) | Not applicable — each strategy runs its own rules |
| What you're checking | Long-term CAGR, drawdown, dividend growth | Combined drawdown, overlap, and correlation between strategies |
Why Active Traders Need to Test the Whole Portfolio
If you only run one strategy, a single-strategy backtest is enough. Most traders do not stay there for long. You add a second setup because the first one goes quiet in certain conditions. Then a third, because you found something that works on a different timeframe. Fair enough — that is how most trading businesses grow.
The problem shows up later. Each strategy looked fine in isolation. Then a volatile week hits and all three lose money at once, because they were secretly reacting to the same market condition. Nobody planned that. Nobody backtested for it either, because nobody looked at the combined picture — only the individual ones.
A 1:1 risk-reward setup that works well alone can quietly double your risk when it is paired with a second strategy that behaves the same way under stress. Win rate alone means nothing here. Combined drawdown, overlap, and correlation decide whether your "portfolio" of strategies is actually diversified or just the same bet, placed three times.
A simple, hypothetical example. Say Strategy A is an index options basket that backtests to a 28% max drawdown on its own. Strategy B is a swing equity setup that backtests to an 18% max drawdown on its own. Run separately, both look survivable. Line up the dates and you might find both strategies had their worst month in the same volatile stretch — because both quietly depend on calm, range-bound conditions to perform well. Combined, the portfolio's real drawdown during that month is closer to 35-40%, not the 28% you'd expect from "just add the bigger one." That gap is invisible until you test the portfolio, not the pieces.
How to Backtest Your Full Trading Portfolio
You do not need a hedge-fund quant desk for this. You need fixed rules, a place to test each strategy, and a way to tag and combine the results afterward. Here is the process.
- List every strategy you actually trade. Not the ones you think about. The ones with real entries and exits you follow. Write down the fixed rules for each one — entry trigger, stop loss, target, position size, and the instrument or market it trades. If you cannot write the rule down in a sentence, you cannot backtest it. You can only guess at it, which is a different exercise wearing a backtest's clothes.
- Backtest each strategy separately first. Use bar replay or historical charts and run each strategy on its own, following its rules exactly, one candle at a time. Random entries on old charts are still random entries — fixed rules are what make this a backtest instead of a guessing exercise dressed up with historical data.
- Use enough history to matter, per strategy. A handful of trades proves very little. A three-year window is close to meaningless on its own — markets can trend, chop, or crash for three years straight and tell you nothing about the other conditions. Test each strategy across trending, ranging, and volatile periods so you are not just measuring one lucky stretch dressed up as skill.
- Tag every trade by strategy as you log it. This is the step most traders skip, and it is the one the rest of this process depends on. Without tags, you have a pile of trades and no way to separate "Strategy A" results from "Strategy B" later — you would have to reconstruct it from memory, which is worse than not testing at all.
- Line up the results on a shared timeline. Look at the dates, not just the totals. Which strategies had losing weeks at the same time? Which ones were quiet while another was drawing down? Plot the equity curves side by side if you can — the overlap you can see is the real portfolio-level insight, not the combined P&L number on its own.
- Check the combined drawdown, not just the combined return. A portfolio that returns well on paper but has every strategy losing in the same month has a concentration problem you cannot see by looking at each strategy alone. Drawdown is what you actually live through; return is just the number left over afterward.
- Account for shared capital and costs. If two strategies would both want a position on at the same time, decide upfront how you'd split capital between them — a backtest that assumes unlimited capital for every strategy overstates what would really happen. Include commissions and slippage per trade, not just at the end.
- Review it like a business, on a schedule. Monthly or quarterly, re-pull the combined numbers as part of a regular trading performance review, instead of only checking when something feels off. Markets change, regulations change, and a strategy that diversified your portfolio a year ago might quietly stop doing that without announcing it.
None of this requires code. It requires a bar-replay tool for the individual backtests — see how to backtest on TradingView if that's where you're testing each strategy — and a journal with tagging and analytics to combine the results without doing the math by hand.
Portfolio Backtesting vs. Forward Testing
A backtest and a forward test answer related but different questions, and mixing them up is how traders end up overconfident right before a rough month.
Portfolio backtesting runs your strategies against data that already happened. It is fast — you can test years of history in an afternoon — and it is where you catch broken rules, unrealistic entries, and the overlap problem described above. Its weakness is exactly its strength: the market already knows what happened, so a backtest can flatter a strategy that was quietly shaped around that specific history.
Forward testing (also called paper trading) runs the same fixed rules on live, unseen data going forward, without real money on the line. It is slower — you cannot forward-test five years in an afternoon — but it confirms whether the edge your backtest found still holds up when the market has not been seen by you or your rules yet.
Use both, in order. Backtest your full portfolio first to rule out the strategies that never had an edge, or that quietly share the same risk. Then forward-test the survivors for a few weeks or months before committing real size. A good backtest is not the finish line — live execution adds waiting, fear, greed, and pressure that no spreadsheet can simulate.
Seven Good Months, Then the Rules Changed
I ran a basket of zero-DTE straddle and strangle strategies for 11 months — a small portfolio of related options strategies rather than one single setup. Seven of those months were profitable. The rest sat close to breakeven. On paper, it looked like a decent portfolio: not every month was a winner, but the combination held up.
Then SEBI limited weekly options expiries to one benchmark index per exchange. That single regulatory change altered the conditions the entire basket depended on. The backtest that got me there was not wrong — it was accurate for the market that existed when I ran it. It just stopped describing the market that existed after the rules changed.
I stopped trading the basket instead of defending a strategy that no longer fit the market. That is the part of portfolio backtesting nobody puts in the marketing copy: a good backtest is not the finish line. It is a snapshot, and snapshots go out of date.
Metrics That Matter at the Portfolio Level
Individual strategy stats — win rate, average R, profit factor — are still useful. At the portfolio level, a few more matter just as much, and most single-strategy backtesting tools do not show them at all.
| Metric | What it tells you |
|---|---|
| Combined drawdown | Your worst peak-to-trough loss when every strategy's results are added together, not viewed separately. |
| Overlap by date | Whether two or more strategies lose money in the same week — a sign they share the same underlying risk. |
| Win rate by tag | How each strategy performs on its own, so a bad month for the portfolio does not get pinned on the wrong setup. |
| Position count over time | How many strategies were live at once — useful for spotting when you were overexposed without noticing. |
You do not need a correlation coefficient to the third decimal place to use this. A simple side-by-side of tagged equity curves, reviewed honestly, tells you most of what matters.
Correlation is the one traders skip because it sounds academic. In practice it is simple: pull up the weekly or monthly P&L for each tagged strategy, and eyeball whether the good weeks and bad weeks line up. If Strategy A and Strategy B both had their worst week in the same volatile stretch, they are correlated whether or not you ever calculate the number. That is the situation the worked example above described, and it is the single biggest blind spot in single-strategy backtesting.
Position count over time catches a quieter mistake: creeping exposure. A trader who adds a fourth strategy because the third one is "basically the same setup on a different index" often does not notice they are now running four live positions through the same kind of market move. Nobody planned for four at once. The backtest did not either, if it only ever looked at one strategy at a time.

Common Portfolio Backtesting Mistakes
- Testing strategies in isolation and stopping there. Each one looks fine alone. Nobody checks what happens when they all draw down in the same week, because that check only exists at the portfolio level and most tools never prompt you to run it.
- No tags, no way back. If your journal only has winners, congratulations, you invented fiction — and if it has no tags at all, you cannot even tell which strategy the fiction belongs to. Every insight in this guide depends on being able to filter trades by strategy after the fact.
- Too few trades per strategy. Ten good trades on one setup proves very little once you add two more setups on top of it. The sample size problem gets worse, not better, as your portfolio grows, because a weak backtest on Strategy C quietly drags down conclusions about the whole basket.
- Ignoring shared risk. Two strategies on the same index, in the same direction, are not two strategies. They are one bet wearing a disguise, and a portfolio backtest is the only way that becomes obvious before it costs you money.
- Curve-fitting the combination, not just the strategies. It is possible to backtest each strategy honestly and still cherry-pick the combination that happened to avoid every shared drawdown in your sample. If the mix only works for the exact history you tested, it is decoration, not an edge.
- Treating the backtest as permanent. A strategy is only trusted while the data supports it. Markets change. Regulations change. A basket that worked for 11 months is not guaranteed to work for a 12th, and defending it out of loyalty instead of evidence is how traders pay tuition twice for the same lesson.
Backtesting Pitfalls That Apply at Any Level
The mistakes above are specific to combining strategies. These three sit underneath every backtest, single strategy or portfolio, and if any of them are baked into your numbers, nothing built on top of those numbers can be trusted either.
Overfitting (Curve-Fitting)
Overfitting is tuning a strategy's rules until the backtest looks great — not because you found a real edge, but because you kept nudging the stop distance, the entry filter, or the lookback period until the equity curve on that specific stretch of history stopped dipping. At the portfolio level this doubles: you can curve-fit each strategy on its own, then curve-fit the mix of strategies on top of that, and end up with a combined equity curve that never happened anywhere except on your screen. The check is simple — does the strategy still make sense with round, sensible parameter values, or only with oddly specific ones (a 23-period moving average, a 2.7% stop) that exist only because they happened to fit the sample?
Survivorship Bias
Survivorship bias is when your historical data only includes what is still around today — testing against an index's current constituents, for example, quietly drops the companies that went bankrupt or were delisted along the way, which makes the past look calmer and more profitable than it actually was. The same thing happens with strategies: if you only backtest the ones you still trade today and forget the five you tried and abandoned, your basket looks better than your real trading history, because the failures never made it into the sample.
Look-Ahead Bias
Look-ahead bias is using information in a backtest that would not actually have been available at that point in time — sizing a trade off the day's closing price when live you would have had to decide before the close, or including a stock in a historical test because it is part of an index today, when it did not join that index until years later. It is the easiest bias to introduce by accident and the hardest to catch afterward, because the backtest still runs cleanly and produces a real-looking number. It is just a number your live trading could never have actually earned.
None of these three make your numbers wrong on their own — they make your numbers wrong in a specific, checkable way. Ruling them out on every strategy, honestly, before folding it into a combined portfolio is cheap insurance against building a multi-strategy portfolio on top of a result that was never real to begin with.
How Traders Journal Helps
Traders Journal will not pretend to be an ETF-allocation calculator — that is not what it is built for. It is built for the active-trader version of this problem: backtest each strategy through bar replay across futures, forex, crypto, and stock indices worldwide — from the S&P 500 and Nasdaq to NIFTY and BANKNIFTY — tag every trade as you log it, and then use the analytics dashboard to see win rate, P&L, and drawdown broken down by strategy in one place.
That will not build you a correlation matrix, and it will not promise your strategies are diversified. What it does is remove the manual spreadsheet work of pulling your tagged results together, so the portfolio-level review described in this guide takes minutes instead of an evening. Roughly 3,600+ traders currently use it to run this exact workflow, alongside live charting for planning the next trade before it happens.
We built it because the same problem in this guide is the problem I had: strategies tested in silos, results scattered across spreadsheets, and no single place that showed how everything actually fit together once real money was on the line.
There is a free-forever plan to start, and premium is ₹499 / $12 a month if you want the full analytics set.
👉 Start backtesting your full portfolio at TradersJournal.app. Tag your last month of trades by strategy and see what the combined picture actually looks like.