
Time & Sessions
What are 90-minute market cycles in trading?
A 90-minute market cycle is a fixed block of time — not price — that traders use to split a trading session into repeating windows. Each window is read through the same four-phase lens: accumulation, manipulation, distribution, and reversal or continuation. It tells you when to expect a setup to develop, not where price will go.
What it is
A 90-minute cycle is a clock, not a chart pattern
Draw a line every 90 minutes from a fixed session open and you have the grid: 90-minute market cycles. The idea, popularised in ICT and smart-money circles under names like the Quarterly Theory, is that a trading day breaks into a handful of these blocks, and each one tends to move through the same rhythm — a quiet range, a fake move that runs stops, a real move that follows, and then either a continuation or a snap back the other way. None of that comes from an indicator reading the chart. It comes from the clock. That is the whole difference between this and almost everything else in this library: the boundary is decided in advance by the time of day, not by anything price does.
- 01
Fix your anchor time first
Every version of this grid starts from a fixed reference — commonly the New York midnight or session open — and counts forward in 90-minute blocks from there. Pick one anchor and stay with it. Moving the anchor to fit what already happened is not analysis, it is hindsight.
- 02
Mark the block, not a level
A cycle is a time range with a start and an end, for example 7:30–9:00am or 9:00–10:30am New York time. You are marking a window on the clock, the same way you would mark a session. There is no price level to draw.
- 03
Watch for the quiet range first
The early part of a cycle is described as accumulation — price holds inside a tight range while very little happens. If the first part of the block is already trending hard, you are probably not looking at a clean cycle open.
- 04
Look for the run past the range
The manipulation phase is a push through the high or low of that early range, far enough to trigger stops sitting just outside it, before reversing back into the range. This is the part traders use as their reference point — not the accumulation.
- 05
Confirm the move away from the manipulation point
Distribution is the actual directional move — price leaving the range in the opposite direction to the manipulation wick, usually with more conviction than anything seen earlier in the block. Without this leg, the cycle has not done anything tradeable yet.
- 06
Note which cycle you are in relative to the session
A grid usually stacks several 90-minute blocks back to back across a session — for instance three cycles across the New York morning. Which cycle number you are in changes how much weight traders give the read, since the first cycle of a session is treated differently from the last.
Variants
Other ways to run this
The New York AM grid — three cycles back to back
The version described above: three 90-minute blocks stacked across the New York morning, for example 7:30–9:00, 9:00–10:30, and 10:30am–12:00pm. Most ICT-style content teaches this form first, since NY AM usually has the volume to make the shape show up cleanly.
The midnight-anchored 24-hour grid
Quarterly Theory nests the same 90-minute idea inside a full day: starting the count at New York midnight instead of a session open gives roughly sixteen 90-minute blocks across 24 hours, with each one also read as a quarter of a larger 6-hour 'daily quarter.' It is the same clock, just counted from a fixed calendar anchor instead of a session bell.
The 22.5-minute micro-cycle
Some traders apply the same accumulation-manipulation-distribution shape one fractal level down, splitting each 90-minute block into four 22.5-minute micro-cycles. The logic is identical, just faster — which means the anchor-sensitivity problem covered in the limits below gets worse, not better, at a smaller timeframe.
How to read it
The cycle tells you when to look, not which way to bet
What this grid gives you is a time filter: it narrows down when a reversal or continuation is more likely to show up, so you are not staring at the chart evenly across eight hours. The manipulation-then-distribution shape is a specific claim — that stop runs inside the block tend to precede the real move — and that claim is exactly why traders overlay it on things like fair value gaps or order blocks, using the cycle to say when to expect a setup and the price-based tools to say where. On its own, a 90-minute boundary is just a clock. It becomes useful only once you have a rule for what counts as accumulation, what counts as manipulation, and what you do differently in cycle one versus cycle three — and that rule is yours to define and test, not something the grid hands you.
Worked examples
The read above, on a chart
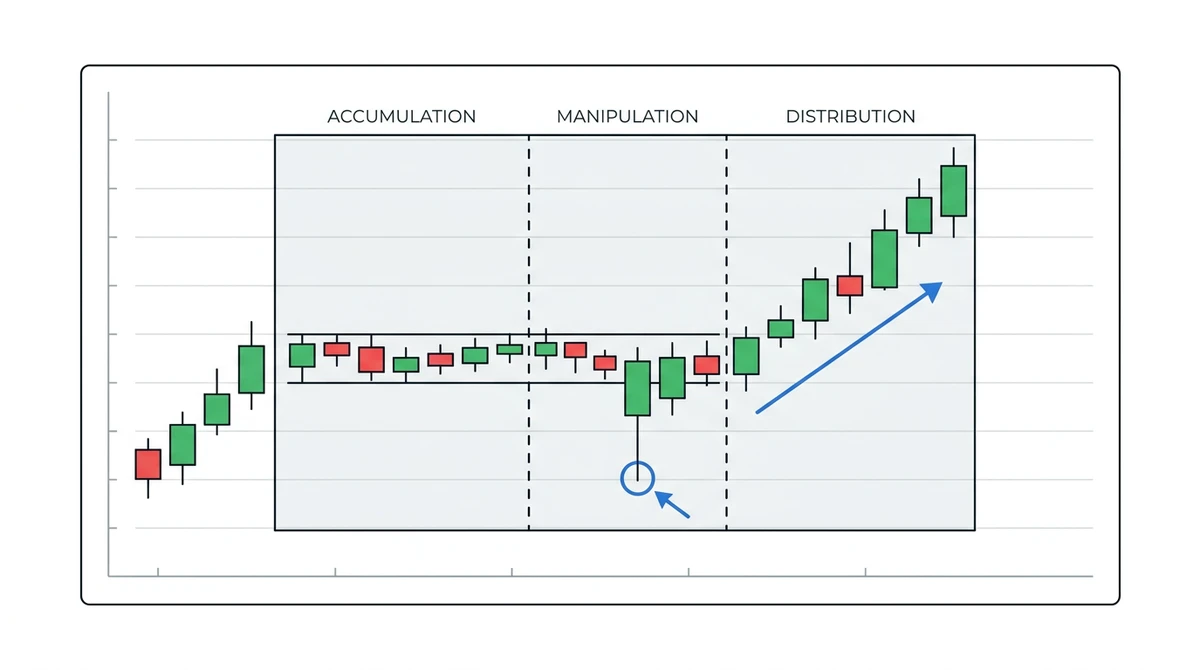
A clean New York AM cycle
Say the 7:30–9:00am New York block opens and price holds in a tight range for the first thirty minutes — the accumulation. Around 8:10, price pushes below that range's low, runs a small cluster of stops, and closes straight back inside the range — the manipulation. From 8:15 onward, price leaves the range to the upside and keeps going into the 9:00 boundary — the distribution. That sequence, in that order, is what traders mean when they say a cycle 'played out clean.'
Illustrative diagram, not a real trade or live price data.
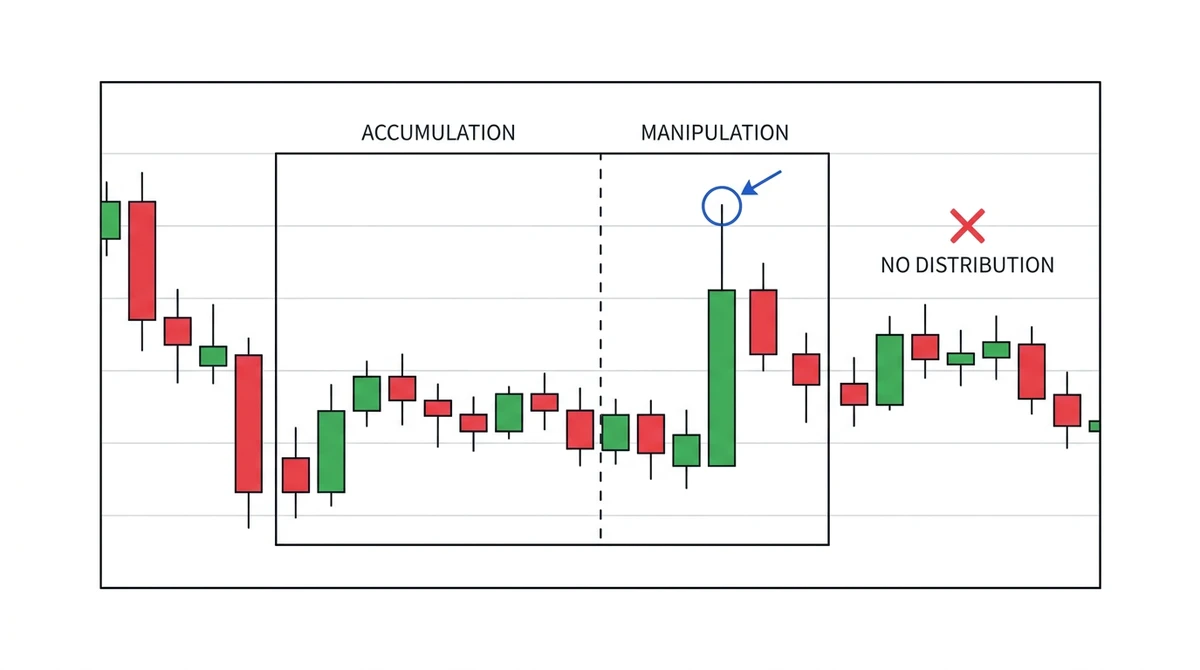
A cycle that stalls after the manipulation wick
Same setup, different outcome: the range holds, a wick pokes above it and closes back inside — accumulation and manipulation both present — but instead of a real move away, price just chops sideways for the rest of the block. Nothing about the clock forces a distribution leg to happen; the manipulation wick alone is not the signal, and treating it as one is how this framework gets misused.
Illustrative diagram, not a real trade or live price data.
A 90-minute cycle is one level of a nested fractal. Here is roughly how the other levels line up, based on the version of Quarterly Theory most commonly taught alongside this grid. Treat the lengths as a rough map, not a fixed rule everyone agrees on.
| Cycle level | Full length | One quarter | Typical reset |
|---|---|---|---|
| Yearly | 12 months | ~3 months | New calendar year |
| Monthly | ~4 weeks | ~1 week | First week of the month |
| Weekly | Mon–Thu trading week | ~1 day | Monday session open |
| Daily | 24 hours | ~6 hours | New York midnight |
| 90-Minute (session) | 6-hour session | 90 minutes | Session open, e.g. NY AM |
Limits
What a 90-minute cycle does not tell you
It does not tell you direction — a manipulation wick can run either way, and nothing about the clock decides which. It does not adapt to the day: a slow, low-volatility session gets the same fixed 90-minute boxes as a high-news day, even though the two behave nothing alike. It relies entirely on your anchor time being right; shift the starting point by even 15 minutes and every box on the grid moves with it, which is also why two traders using slightly different anchors can read the same chart completely differently. And because the framework is built on a specific timezone convention (usually New York time), it needs care to apply outside the sessions it was designed around — a 90-minute grid built for New York open behaves differently against Asian or London session structure. None of that makes the idea wrong. It means the boundary is a hypothesis about when things happen, and like any hypothesis about timing, the only way to know if it holds on your instrument is to run it against real history rather than a handful of charts you already remember the outcome of.
Test the cycle grid before you trade it
A 90-minute cycle is a claim about timing, and a claim about timing is exactly what backtesting is for. Traders Journal's backtesting steps through history bar by bar with the 90-Minute Cycles study on the chart, so you can tag every cycle it draws and see how often the manipulation-then-distribution shape actually held — instead of trusting a memory of the good ones.
Explore backtestingKeep reading
- Read about fair value gaps
- Read about order blocks
- Read about the trading sessions indicator
- Trade the session open with an opening range breakout
- See how VWAP mean reversion uses the same session timing
- Read the gap and go strategy for the same session
- Check strategy quality with the profit factor calculator
- Backtest an indicator on past price
- Browse the indicators library
Questions
What are 90-minute market cycles?
90-minute market cycles are fixed time blocks — usually counted forward from a set anchor like New York midnight — that traders read through a repeating four-phase shape: a quiet accumulation range, a manipulation wick that runs stops past the range, a distribution move in the opposite direction, and a final reversal or continuation. The boundary is set by the clock, not by price.
Where did the 90-minute cycle concept come from?
It comes out of the ICT and smart-money-concepts community, most commonly discussed as part of the Quarterly Theory, which nests 90-minute cycles inside daily, weekly, monthly, and yearly time divisions. It gained wider attention through trader and educator Zeussy's time-based approach to the concept.
What is the AMD framework used inside a 90-minute cycle?
AMD stands for Accumulation, Manipulation, Distribution. Accumulation is the early quiet range. Manipulation is a fake move past the edge of that range designed to trigger stops. Distribution is the real directional move that follows. Some versions add a fourth phase — reversal or continuation — for what happens after distribution.
How do you find the start time of a 90-minute cycle?
You fix a single anchor point first, commonly New York midnight or a session open, and count forward in 90-minute blocks from there. The anchor has to be picked in advance and used consistently — choosing it after the fact to match a move you already saw is not a repeatable method.
Do 90-minute cycles work on every market?
The framework was built around specific trading-day sessions, usually quoted in New York time, so it carries assumptions about liquidity and session structure that do not automatically transfer to every market or timezone. Whether the same 90-minute rhythm shows up cleanly outside the sessions it was designed for is something to check on your own instrument, not assume.
Are 90-minute cycles reliable on their own?
A cycle boundary is a timing filter, not a signal — it narrows down when to watch, not which direction to trade. Traders who use it seriously pair it with a price-based read, like a fair value gap or a break of structure, to decide what to do once the manipulation-and-distribution shape has actually formed. How often that shape holds on your market is a question for testing, not something to take on faith.
Does Traders Journal have a 90-minute cycle indicator?
Yes. 90-Minute Cycles is one of the built-in time studies in Traders Journal's charts and backtesting workspace, so the blocks are drawn automatically against a fixed anchor instead of you counting them out by hand.