43 new drawing tools, cloud alerts and Pine strategies
43 new drawing tools, neatly grouped one click away, plus cloud alerts in beta, Pine strategy trades on your chart, and a faster way to find any symbol.

- 43 new drawing tools — pitchforks, Fibonacci spirals, Gann squares, forecasts, notes and more — grouped so the right one is always a click away
- Precise drawing on your phone, with a trackpad-style cursor and finger-sized handles
- Cloud alerts (beta): set alerts on prices, lines and drawings that keep watching after you close the tab
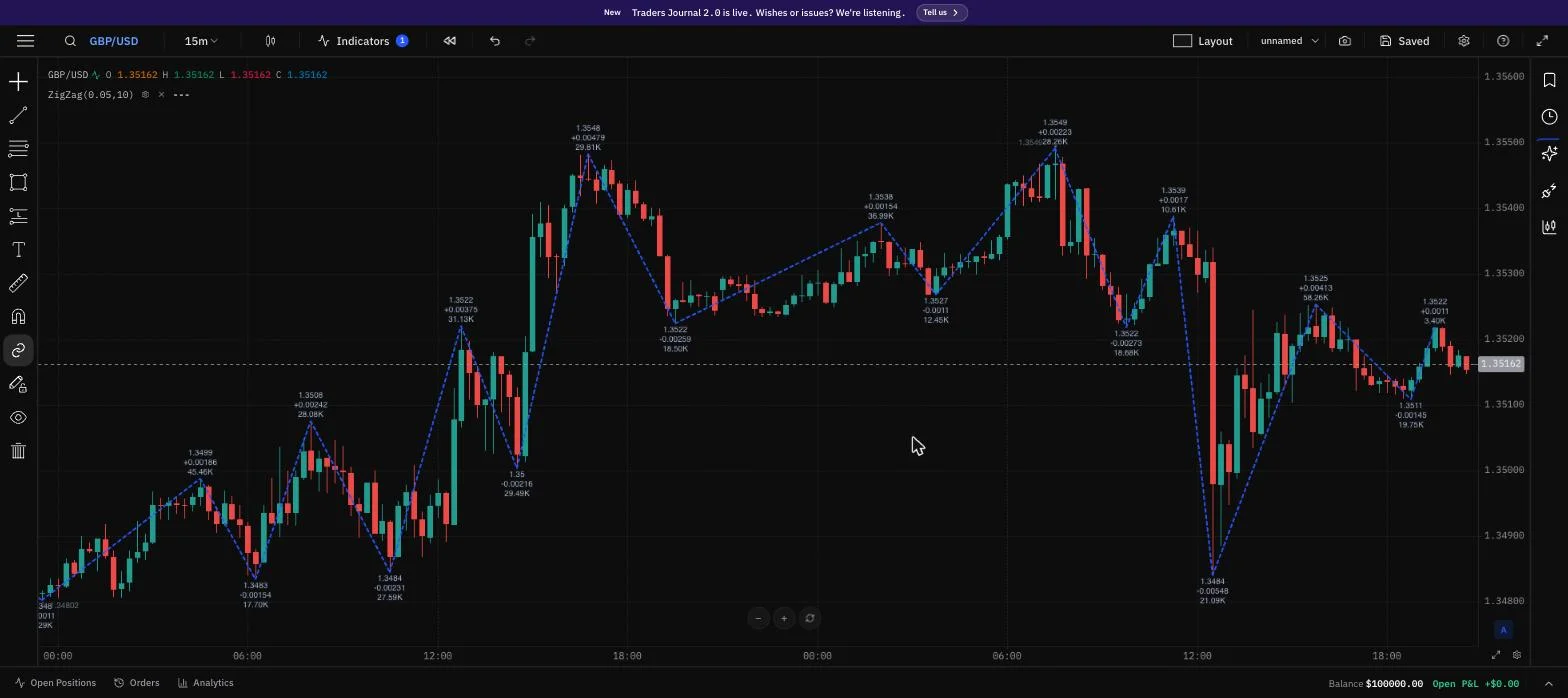
- Pine strategies show their trades on the chart, with a cleaner settings window for every indicator
- A faster symbol search with brand logos, plus smoother broker connections for Kotak Neo, Angel One and Upstox

43 new drawing tools, one click away
- Lines and shapes: ray, extended line, trend angle, rotated rectangle, ellipse, polyline, arc, curves, brush, highlighter and arrow markers.
- Channels and pitchforks: regression trend, flat top/bottom, disjoint channel, and four pitchfork styles.
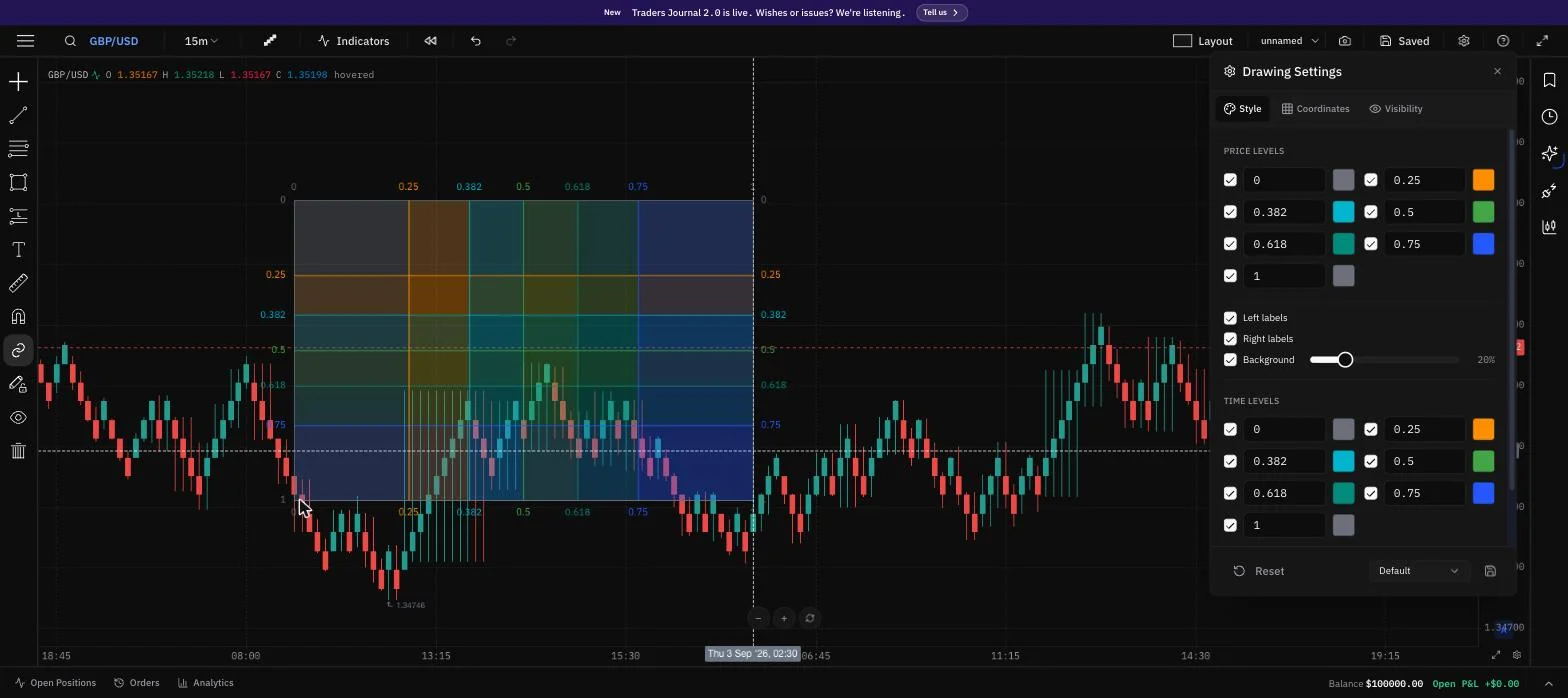
- Fibonacci and Gann: Fib channel, speed fans and arcs, circles, spiral, wedge, trend-based time, pitchfan and two Gann squares. The Fib extension now takes three points, so you can measure from any swing.
- Forecast and cycles: forecast cone, anchored VWAP, cyclic lines, time cycles and sine line, plus a fixed range volume profile.
- Annotations: notes, price notes, pins, comments, signposts, flags and emoji stamps to mark up your ideas.
- Every tool sits in a tidy group with its keyboard shortcut shown, and each group button remembers the tool you used last.
- All of them work in Backtesting too.
Finer control over every drawing

- Every colour now has an opacity slider — lines, text, fills, and profit and risk zones — in a compact new colour picker.
- Save a drawing's style as a template and apply it in one click, on Supercharts and in Backtesting.
- The magnet can snap to indicator values, not just candles.
- Lock drawings, indicators or both separately, so you can keep adjusting one without disturbing the other.
Precise drawing on your phone
- Drag anywhere on the chart to move a cursor, like a trackpad, so your finger never hides the point you're placing.
- Short on-screen steps guide you through each drawing, and handles are sized for fingers.
- Works on Supercharts and in Backtesting.
Cloud alerts (beta)
- Alerts run in the cloud, so they keep watching the market after you close the tab.
- Set conditions on price, indicators or your own drawings, from a redesigned alert window.
- Put an alert on a vertical line to get pinged when that time arrives.
- Drawings with an alert show a small clock badge, and alert lines can be dragged to a new level.
- Your notification choices are remembered, and alerts can reach you by email and browser push.
Pine strategies and a cleaner settings window
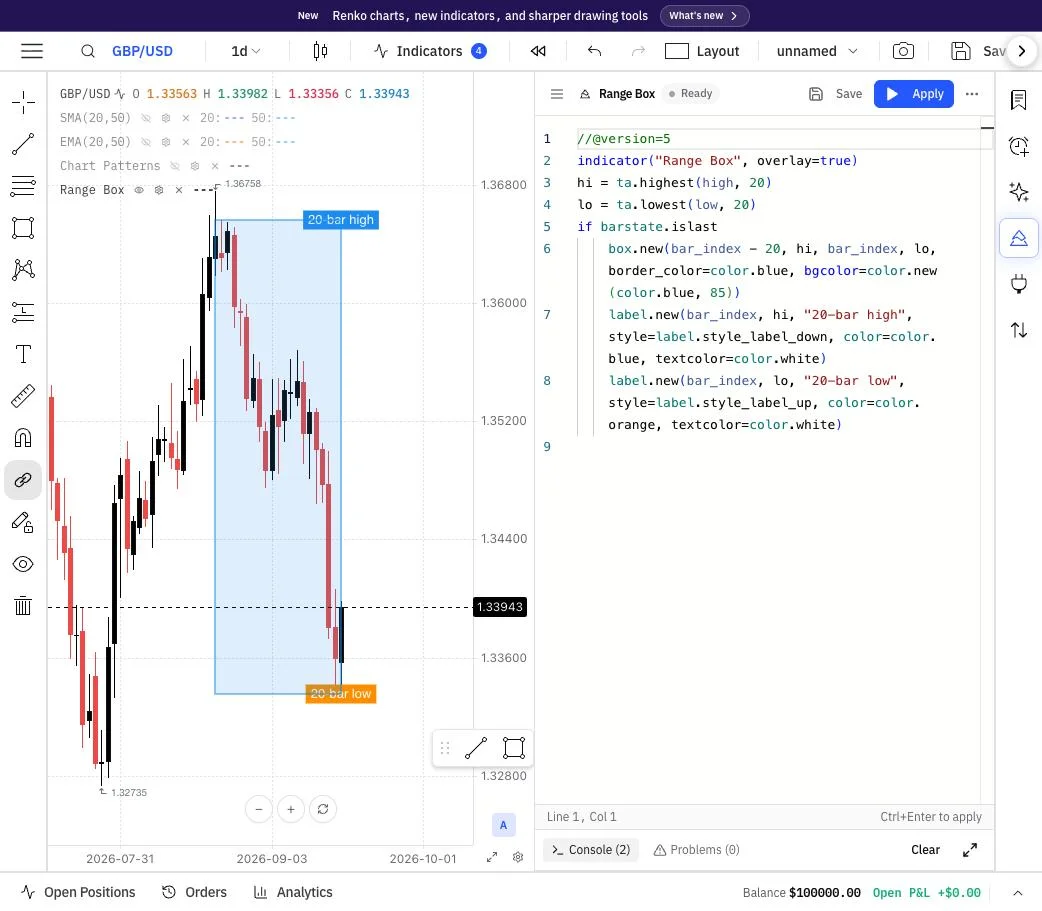
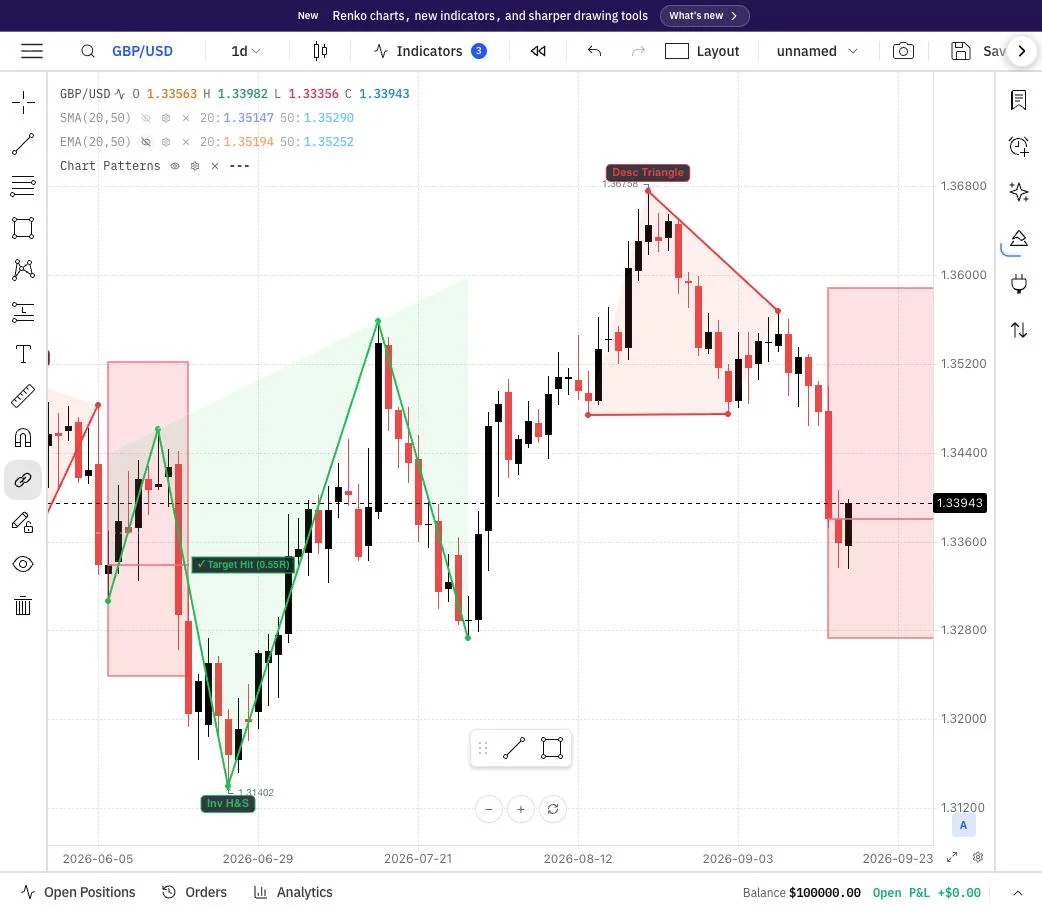
- Pine strategies now show their entries and exits on the chart, and alert() events come through as notices.
- If a script needs a library you haven't added, you get a link to find it and a quick way to paste it in.
- More real-world v6 scripts run without changes.
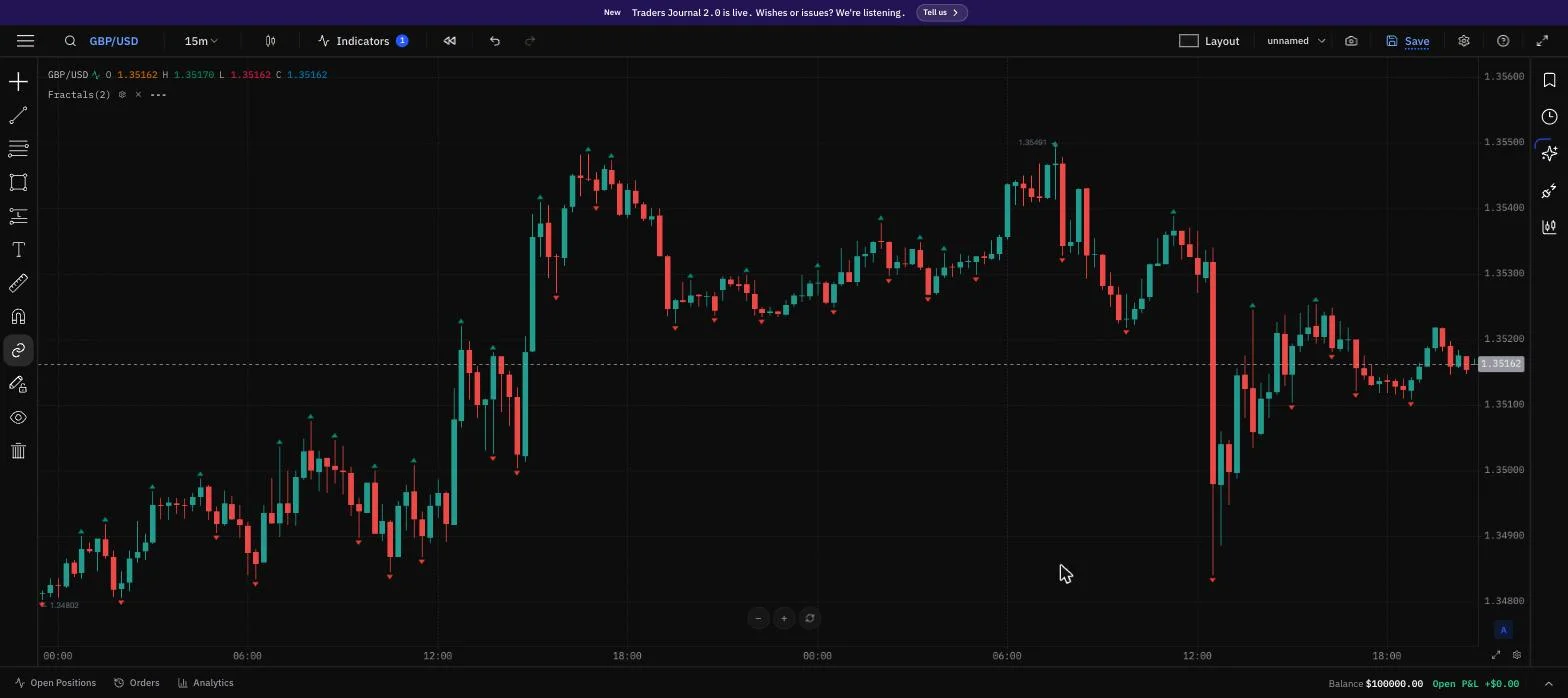
- Indicator settings open in a cleaner window with a Style tab, session ranges and colours with transparency.
- New SFI Charlie indicator.
Find any symbol faster
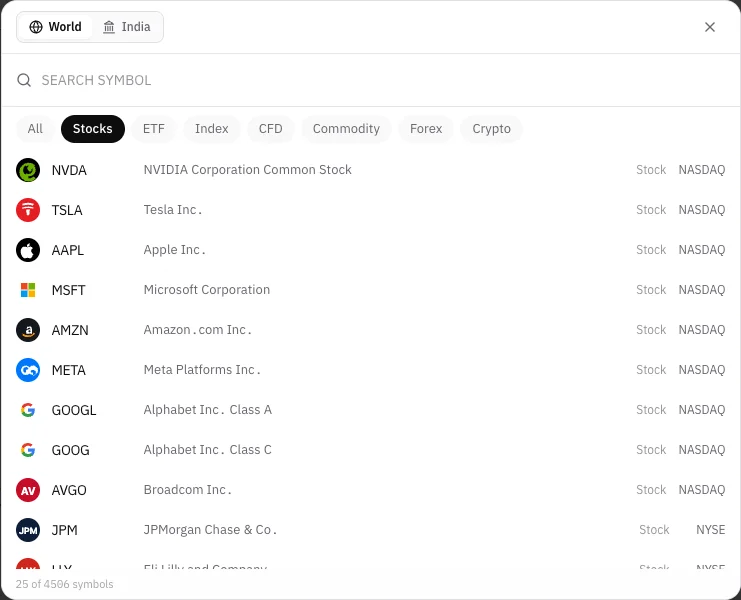
- Stocks and ETFs have their own tabs, and results are ranked so the one you mean comes first.
- Brand logos next to each stock make the list quick to scan.
- Each crypto coin shows up once, with its other exchanges one tap away.
- In the India tab, index futures and options now sit under F&O where you'd expect them.
Smoother broker connections
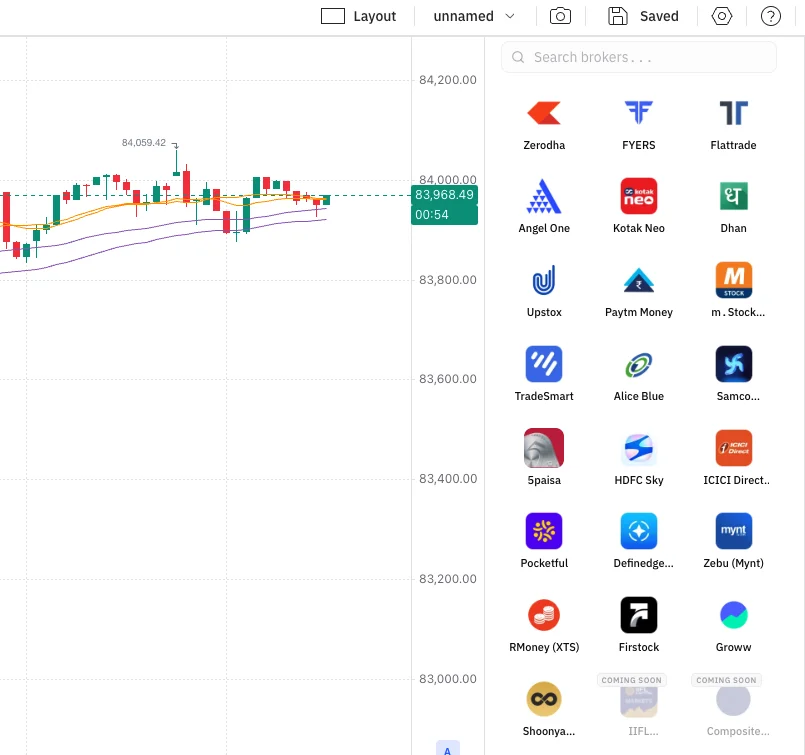
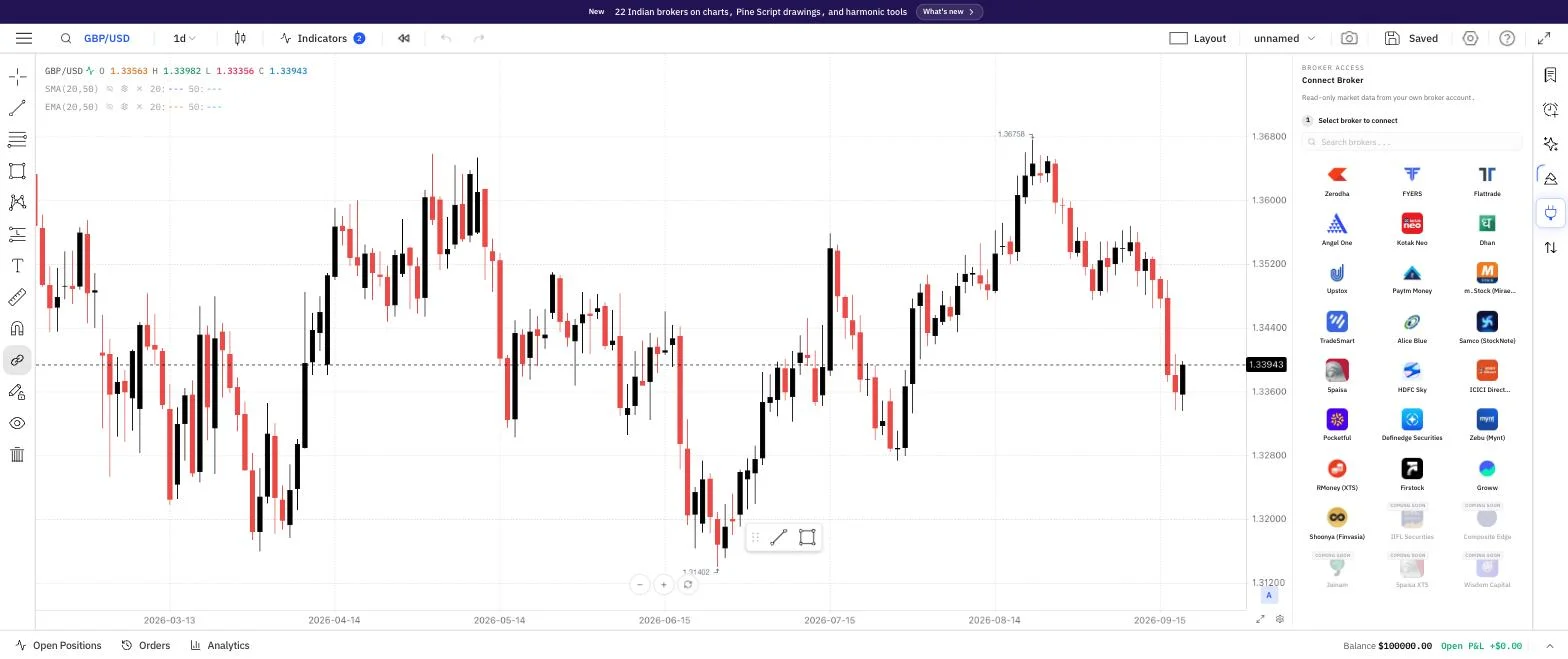
- Connect any of your Indian brokers from a searchable panel beside the chart, without leaving Supercharts.
- Upstox charts and live prices run on its market data connection, and trade sync picks up where it left off if interrupted.
- FYERS history loads in one or two requests instead of dozens, so charts open faster.
Guided setup for Kotak Neo and Angel One
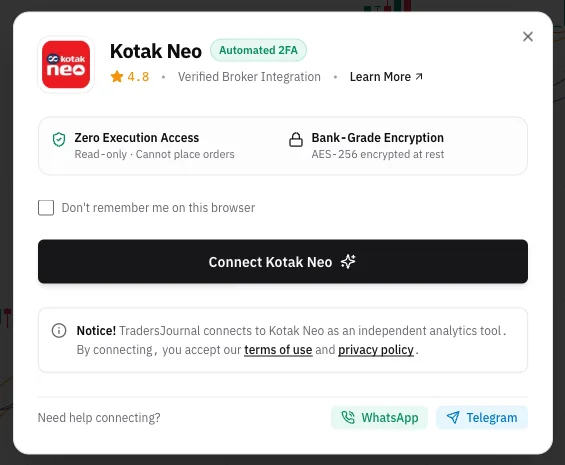
- Kotak Neo and Angel One connect through a guided, step-by-step setup that checks your details as you type.
- Access is read-only: TradersJournal can never place orders, and your details are encrypted.
Fixes
- Switching symbols from the watchlist no longer freezes the chart.
- Weekly and monthly candles on forex symbols no longer draw twice.
- The candle countdown no longer runs while the market is closed.
- In Backtesting, Pine indicators stop at the replay point instead of showing future bars.