
Time & Sessions
What is a trading sessions indicator?
A trading sessions indicator draws the open-to-close window of each major market — Tokyo, London, New York and the rest — as a colored box straight on the chart. It doesn't predict direction. It tells you which market is awake right now, so you can read a volatility spike for what it is instead of guessing.
What it is
A trading sessions indicator is a clock drawn as boxes on price
Forex and index markets don't close the way a stock exchange does — one regional session hands off to the next across a 24-hour cycle. A trading sessions indicator marks that handoff by shading the hours each major session is open, usually as a colored high-low box that grows candle by candle while the session is live. In Traders Journal's own Sessions study, that's five boxes — New York, London, Tokyo, Sydney and Hong Kong — each with its own color, default window, and its own optional mean line, VWAP line, trendline and high/low markers. The point isn't the box itself. It's that liquidity and volatility both move with the clock, and the indicator turns that fact into something you can see instead of something you have to remember.
- 01
Turn on the sessions you actually trade
Every session in the study can be switched on or off independently. If you only trade London and New York, running all five just adds visual noise — enable the two or three that match your trading hours and leave the rest off.
- 02
Read the box as a range, not a signal
While a session is active, its box stretches to the highest high and lowest low printed during that window. A tall box means the session has been volatile so far; a short one means it's been quiet. Neither tells you which way price goes next.
- 03
Watch where two boxes sit on top of each other
An overlap — most commonly London and New York — is where two sessions' liquidity is in the market at the same time. That's the part of the day traders watch most closely, since it's where range expansion most often happens.
- 04
Turn on the mean or VWAP line if you want a reference inside the box
Beyond the plain high-low box, each session can optionally plot its running mean, its volume-weighted average price, a linear trendline, or horizontal lines at its running high and low. These give you a level to react to inside the session, not just a boundary around it.
- 05
Set your anchor timezone once and leave it
Session hours are defined in a fixed timezone (UTC by default, or your exchange's timezone if you switch it on). Changing that anchor shifts every box on the chart, so pick one convention and keep reading it the same way rather than mentally re-timing sessions on the fly.
Variants
Other ways to run this
The London and New York two-session overlay
Intraday currency and index traders frequently turn off Tokyo, Sydney, and Hong Kong to keep the chart clean. Running only London (07:00–16:00 UTC) and New York (13:00–22:00 UTC) isolates the peak volume hours of the day and cleanly highlights the four-hour transatlantic overlap where major breakouts occur.
Session boxes with anchored VWAP and midline references
Instead of displaying only the outer high-low boundary, this variant plots a session-anchored VWAP or running mean line inside each box. This provides an internal fair-value benchmark for intraday mean reversion, letting you see whether price is trading at a premium or discount relative to that specific session's volume.
Exchange-local anchor versus UTC reference
While UTC is the standard benchmark for 24-hour currency markets, equity index and futures traders often re-anchor session boundaries to local market time (such as US Eastern for NYSE/CME). This ensures the session box aligns perfectly with local opening bells and macroeconomic economic releases rather than fixed UTC offsets.
How to read it
The box tells you when liquidity showed up, not where price is going
A trading sessions indicator is a filter, not a forecast. It narrows down when to expect real participation versus thin, directionless drift. Traders lean on that two ways. As context, a breakout during the London/New York overlap carries more weight than the same-looking breakout during a quiet Asian lull, simply because more volume sits behind it. As a building block, strategies like an opening range breakout or a VWAP mean reversion are explicitly session-bound, since the range or average they trade against only makes sense inside one session's window. The box itself has no opinion about direction. What you do with the fact that a session is active, or overlapping, is a separate decision — and one worth testing rather than assuming.
Worked examples
The read above, on a chart
London open breakout from Asian consolidation
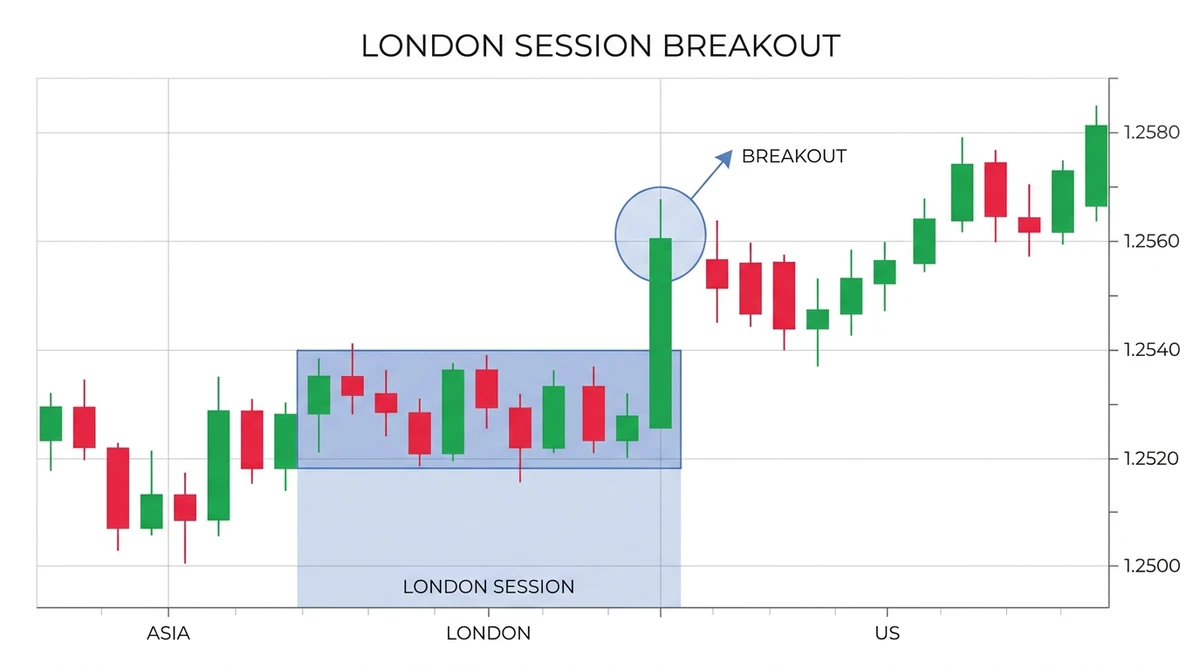
Price consolidates tightly through the overnight Asian session. At 07:00 UTC, the London session box activates and fresh European institutional volume enters the market. A strong displacement candle expands outside the top boundary of the initial session range. Traders use the session box activation as confirmation that real liquidity is driving the expansion rather than low-volume overnight chop.
Illustrative diagram, not a real trade or live price data.
London and New York overlap momentum expansion
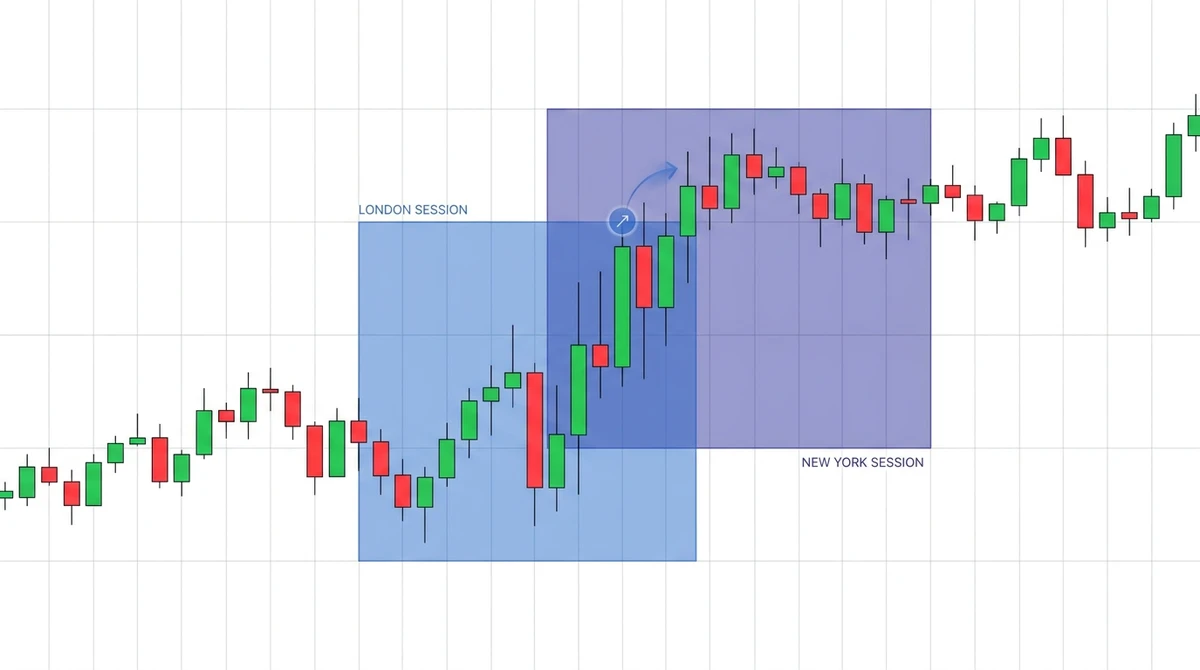
Between 13:00 and 16:00 UTC, the London and New York session boxes overlap on the chart. With traders across both Europe and North America active at once, order flow peaks. Breakouts or continuation legs formed during this dual-session window show sustained momentum and higher average bar range compared to moves initiated outside the overlap window.
Illustrative diagram, not a real trade or live price data.
Traders Journal's Sessions study ships with five sessions enabled by default, each with its own UTC window and color. All five are independently adjustable, and the timezone can be switched to your exchange's local time instead.
| Session | Default window (UTC) | Typical character |
|---|---|---|
| Tokyo | 00:00–09:00 | Opens the day; thinner range outside JPY pairs |
| Hong Kong | 01:00–10:00 | Overlaps Tokyo; adds Asia-Pacific equity flow |
| London | 07:00–16:00 | Highest average volume of the five on FX majors |
| New York | 13:00–22:00 | Overlaps London for roughly four hours |
| Sydney | 21:00–06:00 | Opens the next day; usually the quietest window |
Limits
What a trading sessions indicator does not tell you
It does not tell you direction. An overlap raises the odds of a bigger move, not which way it breaks. It does not adapt to news, either: a scheduled release during a normally quiet Asian session can out-move a routine London morning, and the box has no way to flag that in advance. It relies entirely on the timezone convention you set, so get the anchor wrong and every session boundary on the chart is wrong by the same margin. And the default windows are a reasonable average, not a guarantee. Actual session behavior shifts with the instrument, the day of the week, and the broker's own trading calendar, so treat the boxes as a starting filter to test against your own market rather than a fixed rule.
Test session overlaps before you trade them
Knowing that London/New York overlaps run hotter is easy. Knowing whether that edge actually holds on your instrument is what backtesting is for. Traders Journal's backtesting steps through history bar by bar with the Sessions study on the chart, so you can tag every overlap and measure the range it actually produced instead of trusting a rule of thumb.
Explore backtestingQuestions
What is a trading sessions indicator?
A trading sessions indicator draws the open-to-close hours of major markets — typically Tokyo, London, New York, Sydney and Hong Kong — as colored boxes directly on a price chart. Each box grows to cover the high and low printed while that session is active, giving a visual read of when liquidity and volatility are highest.
What are the main forex trading sessions?
The four most commonly tracked are Tokyo (Asia), London (Europe), New York (US) and Sydney, with Hong Kong sometimes added as a fifth Asia-Pacific window. London and New York carry the highest average volume on major currency pairs, and the roughly four hours where they overlap is typically the most active stretch of the trading day.
Why does the London/New York overlap matter?
During the overlap, liquidity from both financial centers is in the market at once, which is why range expansion and larger moves tend to cluster there more than during a single-session window. It's a higher-probability window for volatility, not a signal that price will move in any particular direction.
Do session boundaries use my local time or a fixed timezone?
They use whatever timezone you set as the anchor — UTC by default, or your exchange's local timezone if you switch it on. Changing that anchor shifts every session box on the chart, so it's worth fixing one convention and reading sessions the same way every time rather than converting on the fly.
Can I customize which sessions are shown?
Yes. Each session can be turned on or off independently, and its window, color, and which extras it plots — a running mean, a VWAP line, a trendline, or high/low markers — are all adjustable separately. Traders who only work London and New York commonly disable the other three to cut down on chart clutter.
Is a trading sessions indicator enough to trade on its own?
No — it's a timing filter, not a signal. It tells you when participation is likely to be higher or lower, which is why it's usually paired with a price-based method, such as an opening range breakout or a VWAP mean reversion, that defines what to actually do once the session's window is open.
Does Traders Journal have a trading sessions indicator?
Yes. Sessions is one of the built-in time studies in Traders Journal's charts and backtesting workspace, with five sessions enabled by default and each one independently configurable, so the boxes are drawn automatically instead of you tracking market hours by hand.