Most "trading journal template" downloads are a spreadsheet with a few price columns and a P&L formula. That's not a journal. That's a trade log wearing a nicer font.
Here's the actual template — the columns worth tracking, ready-to-use versions for Excel, Google Sheets, Obsidian, and Notion, a day-trading variant for fast trades, and the honest point where a spreadsheet stops being enough. Works the same whether you're logging live trades, a paper trade journal while learning, or a plain stock journal for swing positions — and no email address needed to get it.
Free template — no email required
Get the free template →What a Trading Journal Template Should Actually Track
A trading journal is a curated record of your trading experience — the reason, the emotion, and the lesson behind each trade, not just the price it happened at. If the container only holds entry, exit, and profit, it can't show you why you keep making the same trade, good or bad. Split it into three moments:
- Before the trade. The setup, the reason it qualifies, your planned stop and target.
- At the trade. The exact entry — price, time, size, direction. Facts, not feelings.
- After the trade. The result, your emotional state, whether you followed the plan, and one honest line about what you'd do differently.
Skip any of the three and you're left with numbers that can't explain your decision-making. It's also why most templates score results in R, a multiple of risk, instead of raw currency — it strips out the illusion that a $500-risk trade "did better" than a $50-risk trade just because the dollar figure is bigger.
The Core Columns Every Trading Journal Needs
This is the core structure. Copy it into Excel, Google Sheets, Notion, or a plain notebook — the columns matter more than the app they live in.
| Column | What it captures |
|---|---|
| Date & time | For spotting time-of-day patterns later. |
| Symbol & direction | What you traded, long or short. |
| Setup / tag | Breakout, pullback, reversal — a short label to filter by later. |
| Entry, stop, target | The plan, written before you're emotionally attached to the outcome. |
| Size & risk | Position size and how much was actually on the line. |
| Exit & result (R) | Where you got out, as a multiple of risk — comparable across trade sizes. |
| Rule-followed | A simple yes/no. Exposes more bad habits than any other column. |
| Emotion | Calm, anxious, revenge, bored — pick from a short list. |
| Lesson | One line: what you'd repeat, or stop doing. |
Nine columns. Not twenty. A template with every field you can imagine looks thorough on day one and empty by week two, because nobody fills in twenty boxes after a losing trade at 2pm. Options, futures, and crypto traders typically add one or two extras on top (strike/expiry, contract month, exchange) — the real template below already covers most of that ground.
Get the Free Trading Journal Template
You've seen the core columns. Here's the actual sheet, already built, with seven tabs: Start Here, Settings, Trade Log, Dashboard, Analysis, Daily Review, and Checks. No email required to copy it.
What's Inside the Trade Log
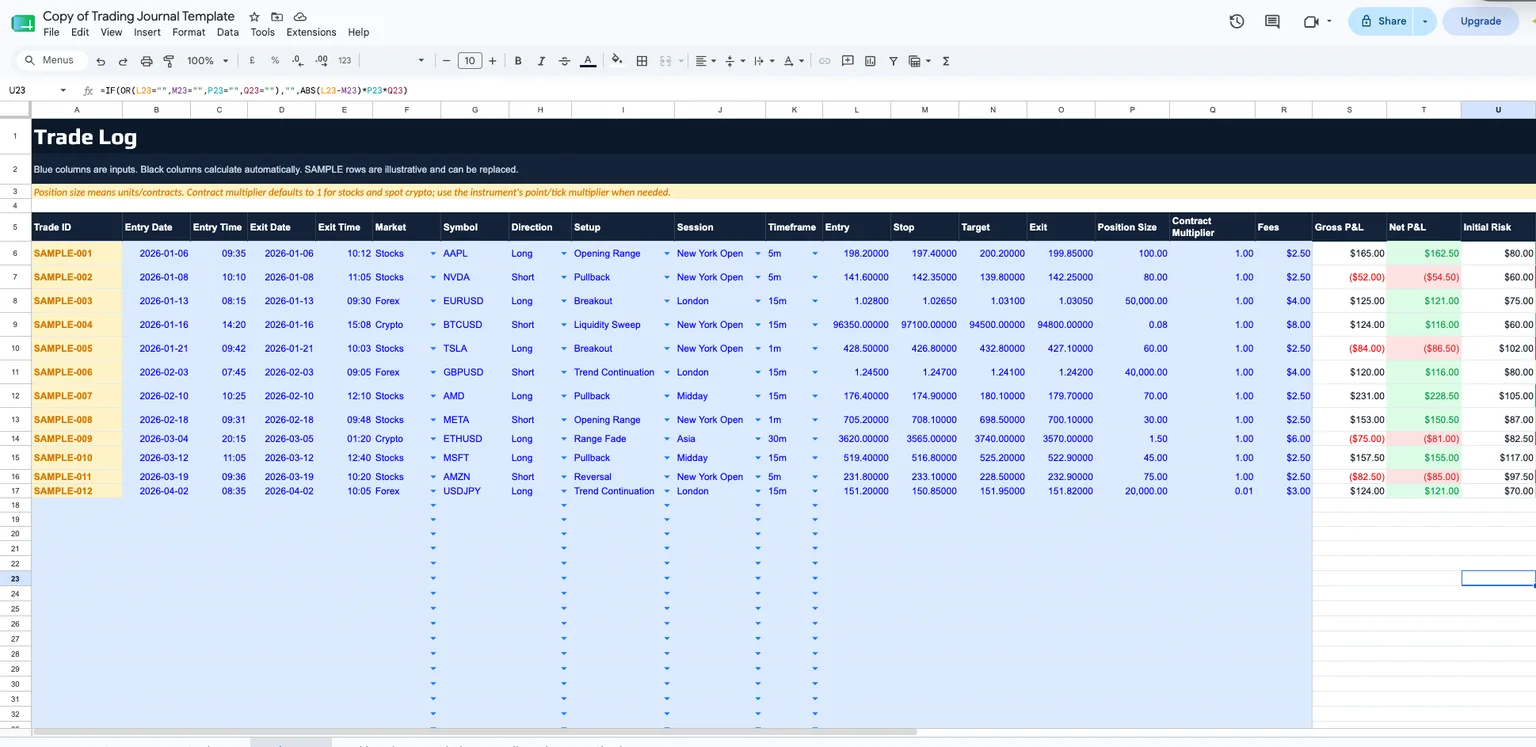
The Trade Log tab is where every trade gets entered. It expands the nine core columns from earlier into 33 practical fields — blue cells are what you type, everything else calculates itself.
Trade Identity & Timing
| Column | What it captures |
|---|---|
| Trade ID | A unique row number, for cross-referencing a screenshot or fill. |
| Entry Date / Entry Time | When you got in — raw material for time-of-day patterns. |
| Exit Date / Exit Time | When you got out — can differ from the entry date on multi-day holds. |
| Market / Symbol | Stocks, forex, crypto, futures, or options, plus the exact ticker. |
| Direction | Long or short. |
| Setup | Your tag — breakout, pullback, reversal — for filtering later. |
| Session / Timeframe | Pre-market through close, and the chart you executed on. |
The Plan: Price & Size
| Column | What it captures |
|---|---|
| Entry / Stop / Target | The plan, written before you're emotionally attached to the outcome. |
| Exit | Where you actually got out — not always where planned. |
| Position Size | Units or contracts traded. |
| Contract Multiplier | Point/tick value — 1 for stocks and spot crypto, instrument-specific otherwise. |
| Fees | Commission and spread cost, so P&L reflects what hit your account. |
Result & Risk Math
| Column | What it captures |
|---|---|
| Gross P&L / Net P&L | Profit or loss before and after fees. |
| Initial Risk | Dollar amount risked, based on the entry-to-stop distance and size. |
| R-Multiple / Planned R:R | Result as a multiple of risk, next to the ratio you planned. |
| Outcome | Win, loss, or breakeven. |
| Hold (min) | Minutes in the trade. |
Account Context & Review
| Column | What it captures |
|---|---|
| Account Balance / Drawdown % | Running balance after the trade, and how far below peak it sits. |
| Rules Followed | A simple yes/no — exposes more bad habits than any other column. |
| Emotion | Calm, confident, anxious, FOMO, revenge, tired — pick from a short list. |
| Grade | An A–F execution grade, separate from whether the trade won. |
| Mistake Tag / Confidence (1-5) | The recurring error, if any, and how sure you were at entry. |
| Screenshot URL | A link to the chart, so proof lives next to the numbers. |
That's more than the nine-column starting point on purpose. If 33 fields feels like a lot on day one, fill in the nine core ones first and let the rest sit blank until you're ready.
What the 12 SAMPLE Rows Actually Look Like
Columns are easier to picture with real rows under them. These are the actual SAMPLE-001 through SAMPLE-012 rows already sitting in the free template above — not a mockup, the same rows you'll see the moment you open it:
| Date | Symbol | Setup | Entry | Exit | Result (R) | Outcome | Rules? | Note |
|---|---|---|---|---|---|---|---|---|
| Jan 6 | AAPL (long) | Opening Range | 198.20 | 199.85 | +2.03x | Win | Yes | Focused |
| Jan 8 | NVDA (short) | Pullback | 141.60 | 142.25 | -0.91x | Loss | No | FOMO — late entry |
| Jan 13 | EUR/USD (long) | Breakout | 1.0280 | 1.0305 | +1.61x | Win | Yes | Calm |
| Jan 16 | BTC/USD (short) | Liquidity Sweep | 96,350 | 94,800 | +1.93x | Win | Yes | Confident |
| Jan 21 | TSLA (long) | Breakout | 428.50 | 427.10 | -0.85x | Loss | No | Anxious — early entry |
| Feb 3 | GBP/USD (short) | Trend Continuation | 1.2450 | 1.2420 | +1.45x | Win | Yes | Focused |
| Feb 10 | AMD (long) | Pullback | 176.40 | 179.70 | +2.18x | Win | Yes | Calm |
| Feb 18 | META (short) | Opening Range | 705.20 | 700.10 | +1.73x | Win | Yes | Confident |
| Mar 4 | ETH/USD (long) | Range Fade | 3,620 | 3,570 | -0.98x | Loss | No | Tired — moved stop |
| Mar 12 | MSFT (long) | Pullback | 519.40 | 522.90 | +1.32x | Win | Yes | Calm |
| Mar 19 | AMZN (short) | Reversal | 231.80 | 232.90 | -0.87x | Loss | No | Revenge — revenge trade |
| Apr 2 | USD/JPY (long) | Trend Continuation | 151.20 | 151.82 | +1.73x | Win | Yes | Focused |
Eight wins, four losses — a 66.7% win rate and +0.86R average across all twelve. Not a curated highlight reel: the four losses are the four rows with "No" in the Rules column. Every loss in this template happened because the plan wasn't followed, not because the plan was bad. That's what the Rules-Followed column is for — grading the process, not just the outcome.
Dashboard, Analysis & Daily Review — Calculated For You
Log a trade above and three other tabs update on their own — no pivot tables, no dragged formulas. The 12 SAMPLE rows above land at 66.7% win rate, +0.86R average, and $863.50 net P&L the moment they're entered:
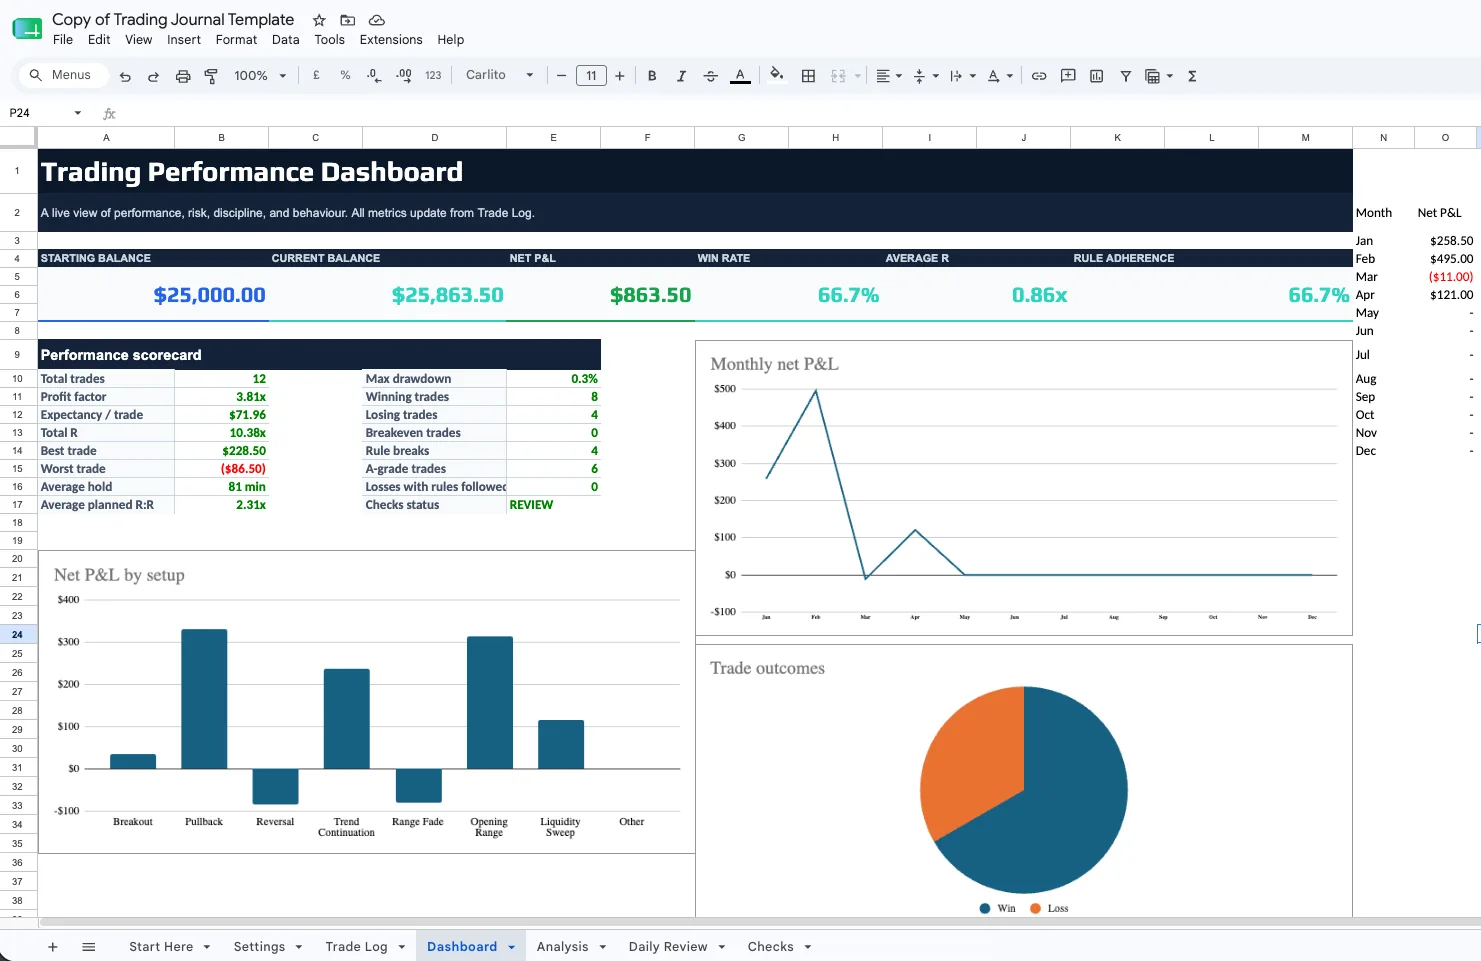
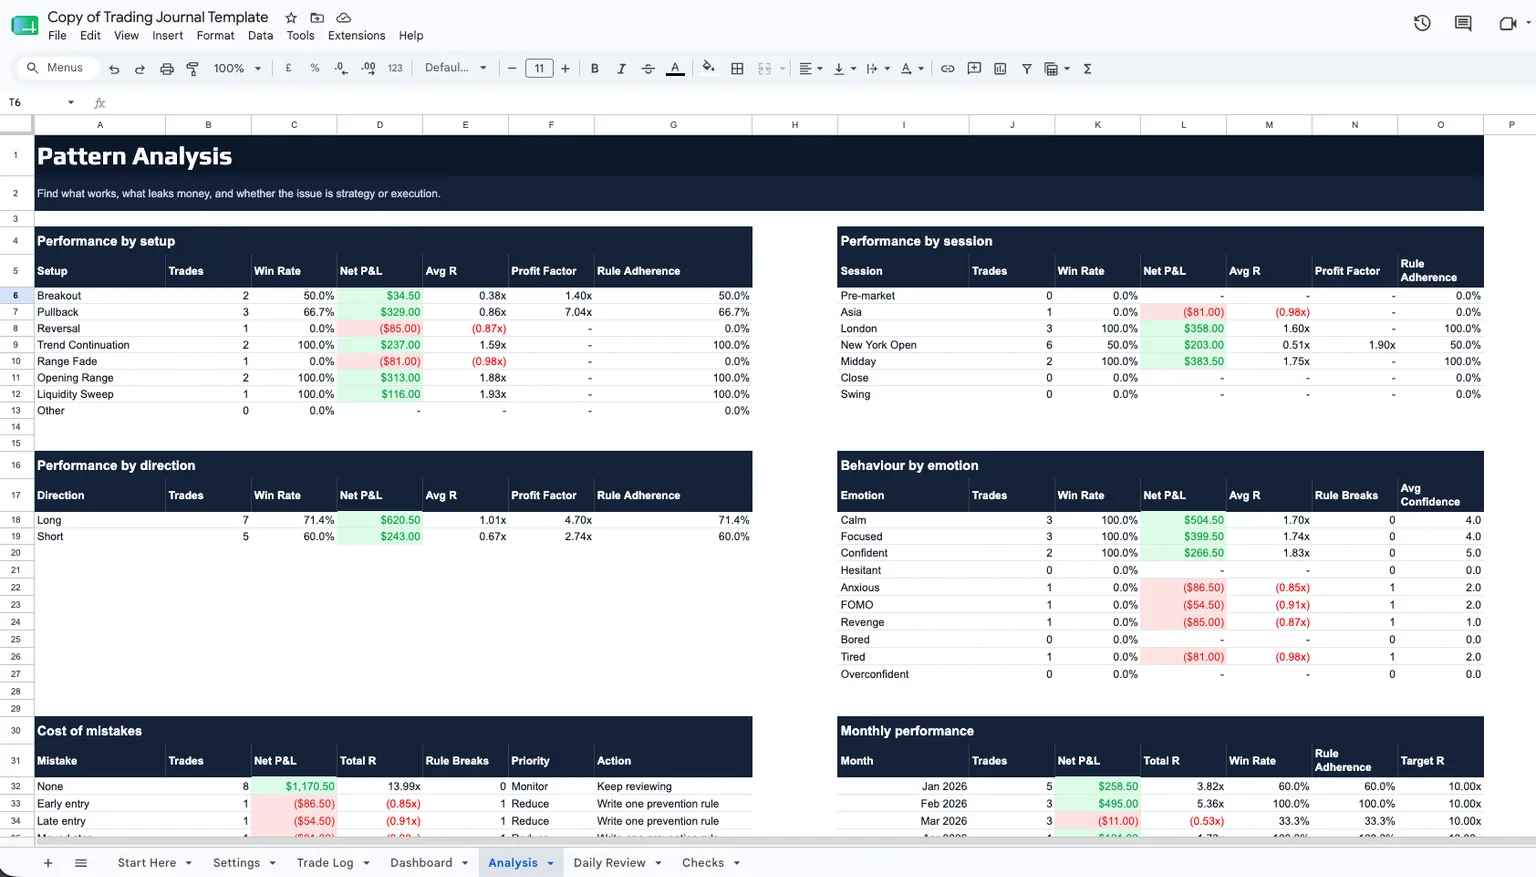
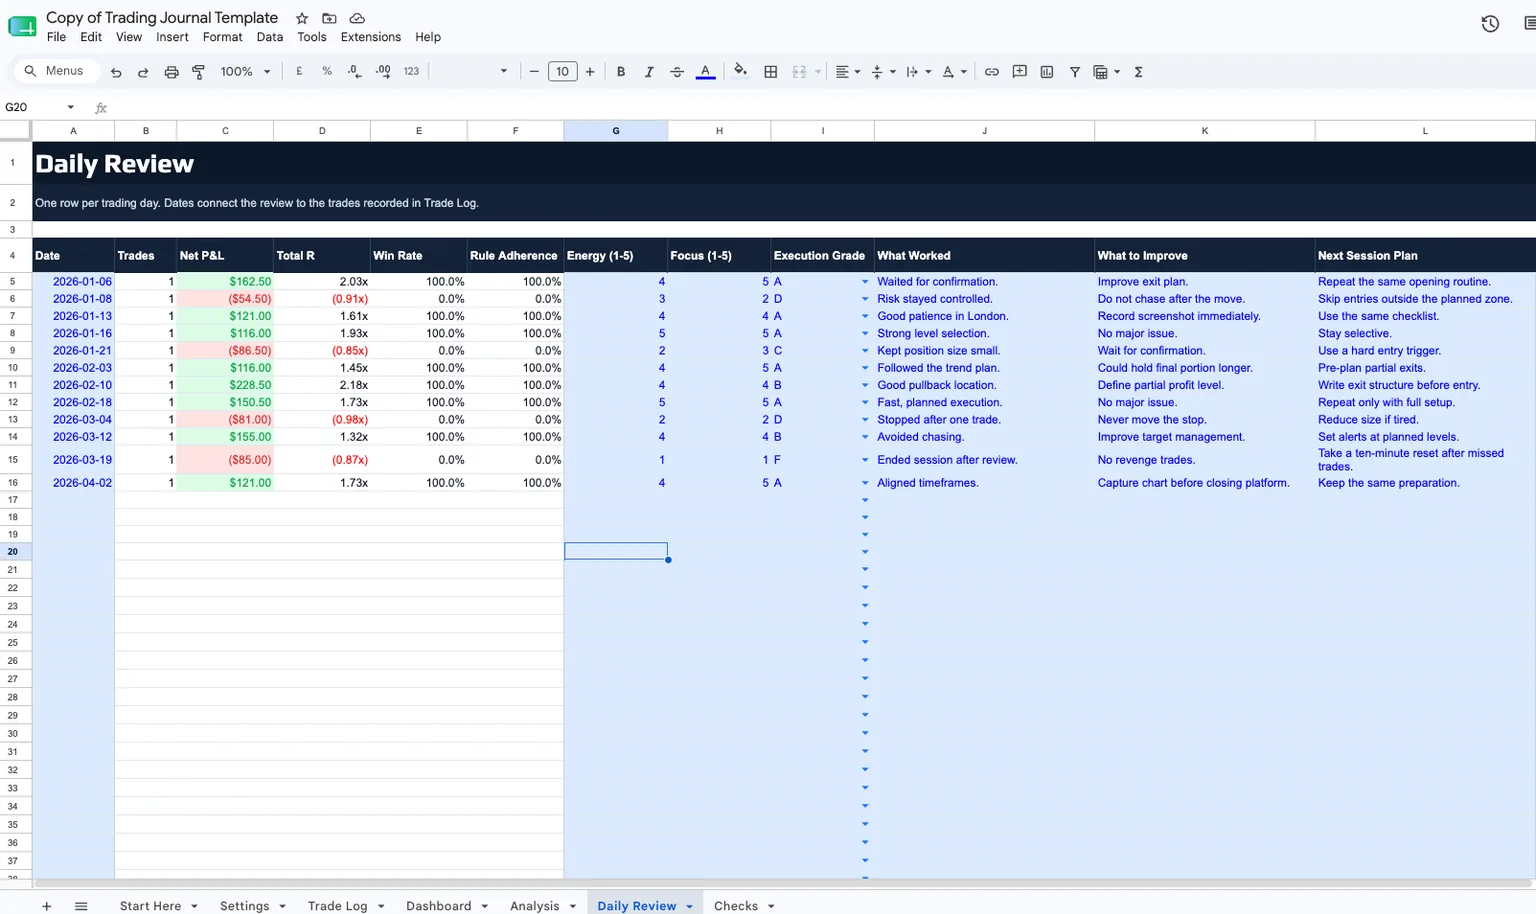
Settings and Checks round out the sheet quietly — set your account size once, and Checks flags whether your rule-adherence is actually holding up.
Make your own copy — sample trades included, ready to replace
Get the free template →Excel, Google Sheets, Obsidian & Notion — Same Columns, Different Home
The free template above already covers Excel and Google Sheets — it's one file, opened two ways. Prefer to build your own trading journal excel template from scratch? Create one sheet named Trades with the nine columns as headers, add a Summary sheet, and use data-validation dropdowns for setup, emotion, and rule-followed so you're picking from a list instead of retyping. Two formulas cover most of it:
Win rate:  =COUNTIF(Trades!G:G,">0") / COUNTA(Trades!G:G)
Average R: =AVERAGE(Trades!G:G)
Point column G at your result-in-R column and both update on their own — no dragging ranges by hand. Need a trading journal PDF for a mentor review? File → Print → Save as PDF. A trading journal google sheets template uses the exact same setup, with the added advantage of autosave, phone access, and a read-only link you can share without emailing a file back and forth.
An obsidian trading journal template fits a different kind of trader — one who thinks in notes and links more than rows and columns. Obsidian doesn't ship one built-in, but it's simple to build: a daily note per trading day, a short front-matter block for the structured numbers (symbol, entry, exit, result_r, tags), and free-form notes underneath for the reasoning — the part spreadsheets squeeze into one cramped cell. A notion journal template works on the same idea but as a database: build one table with the nine core columns as properties, then open any row as a full page for the screenshot and reasoning. Filtered views do what a pivot table does in Excel, without writing a formula.
What Day Trading Adds
A day trading journal template — or an intraday trading excel sheet, if that's the term you searched — needs a few extra fields, because the trades are fast and repeated in the same session:
- Session. Pre-market, open, mid-day, or close — most day traders have one that quietly loses money and one that quietly makes it.
- Timeframe. The chart you actually executed on — 1-minute, 5-minute, whatever it was.
- Hold time. Missing target by seconds is a different problem than running into a stop because you froze.
- Trade number of the day. Your fifth trade after two losses behaves nothing like your first — this makes that visible.
Day trading mistakes rarely live in the setup — they live in the speed. A template that only tracks price action can't catch that. One that tracks session and trade number can.
Trading Journal Format Comparison: Which Fits You
Same nine columns, five different containers. The right format depends on how you actually work, not which app looks the most impressive in a screenshot.
| Format | Best for | Automatic stats | Mobile logging |
|---|---|---|---|
| Excel | Offline, familiar, one device | Yes, once formulas are built | Weak |
| Google Sheets | Multi-device, sharing with a mentor | Yes, same formulas as Excel | Good, with a linked Form |
| Obsidian | Writers, note-linkers, context-heavy review | Only with the Dataview plugin | Okay, with sync enabled |
| Notion | Filtering, grouping, and page-per-trade context | Yes, via filtered database views | Good, with the mobile app |
| Dedicated app | Volume, screenshots, zero manual formulas | Automatic | Built in |
None of these is objectively "best" — it's whichever you'll still be filling in honestly three months from now. Already outgrown all five? Our free TradeZella alternative covers what that looks like.
The Honest Limits of a Trading Journal Template
I logged my own trades in Excel for the better part of a year. It calculated my ratios fine — it just couldn't show me what I actually saw on the chart when I took the trade. Eventually I moved to a private channel where every entry came with a screenshot and the reasoning behind it. The numbers were never the problem. The missing context was.
That's the honest ceiling on any spreadsheet template, no matter how well you build it:
- Screenshots get messy fast. Pasted images bloat the file and break on mobile.
- Every stat is a manual formula. One dragged cell, one typo, and your win rate is quietly wrong for a month.
- Filtering by setup takes real spreadsheet skill. Pivot tables work, but most traders don't build them.
- It's easy to skip when busy. No reminder, no streak, no friction — just a row that stays blank.
None of this means don't use a template. It means know what it's for: a clean, honest starting point — not necessarily where you finish. These limits rarely show up when the sheet is new; they show up around trade one-fifty or two hundred, once the file's grown heavy and the formulas have been "fixed" a few times.
When to Upgrade From a Template to a Journal App
There's no magic trade count where a spreadsheet stops working. The real signal is time: once maintaining the sheet — fixing formulas, resizing screenshot cells, recalculating last month's stats — takes more of it than actually reviewing trades, the tool is working against you. Watch for these three specifically:
- You stop trusting your own numbers. A formula broke three weeks ago and you only just noticed.
- Screenshots and notes live somewhere else. The price data's in the sheet; the context is scattered across your camera roll.
- You've stopped reviewing weekly. Not because you don't care — opening 200 rows has quietly become a chore.
None of that familiar yet? Keep using the template — free and simple beats fancy and abandoned. If it is, upgrading looks like this: export the spreadsheet as CSV, import it into a journaling app that accepts the same columns (or auto-syncs with your broker so you stop typing entries by hand), and keep the habit exactly the same — plan, log, review. The tool changes; the discipline doesn't. Our breakdown of the best free trading journal software is a reasonable next stop if you're at that point.
How to Actually Use the Template Every Day
A template you fill in for three days and then abandon is not a journal. It's a to-do list you felt briefly good about. Five habits that keep it alive past week one:
- Fill the setup and levels before you enter, not after. Writing the plan first turns a journal into evidence instead of a story you tell yourself afterward.
- Log the entry the moment it's live. Ten seconds — price, time, size, direction. Wait until end of day and you'll misremember it.
- Review after every close, win or lose. A journal with only winning trades hasn't failed to make you money — it's failed to tell you the truth.
- Read it back weekly, not daily. Daily is too close to the noise; weekly gives enough distance to see a pattern.
- Keep your setup tags consistent. "Breakout," "Break out," and "BO" are three different tags to a filter, even if they mean the same thing to you. Pick one spelling and stick to it — or let the dropdown list from earlier do that job automatically.
Backtesting is boring until it saves you from donating real money to a strategy that only worked in your head. A journal template is the same deal, minus the boring part.
Common Trading Journal Template Mistakes
Most templates don't fail because the columns were wrong. They fail for a handful of predictable reasons:
- Only logging winners. If your journal only has winners, congratulations — that's confirmation bias at work, not a track record. It's just quietly editing history.
- Copying someone else's exact column list. A futures scalper and a swing-trading investor don't need the same template. Start from the nine core columns, then adjust for your market.
- Filling in the numbers, skipping the lesson column. Price without the reason attached is a trade log. The one-line lesson is the entire point.
- Building it once and never opening it again. A template you don't review weekly is a diary you don't read.
- Making it heavier every bad week. A rough patch is a reason to read the columns you already have, not add five more.
Months of trades logged with no idea what they're telling you? Our guide on analyzing trading performance with a journal turns those rows into decisions.
How Traders Journal Helps
Every trade carries its own story — the setup, the emotion, the context around it. A spreadsheet can hold the numbers; it was never built to hold the rest. That's the exact gap I hit with my own Excel sheet earlier in this guide, and the reason this exists at all.
We built Traders Journal so the same nine columns from this template fill in next to a live chart, a screenshot, and a tag, with the stats calculating themselves. No dragged formulas, no broken ranges. Roughly 3,600+ traders use it today.
It includes live charting, a trade journal with tags and screenshots, a dashboard with automatic stats, backtesting with bar replay, and AI insights that flag your patterns. There's a free forever plan to start, and premium runs ₹499 / $12 a month if you want the full set.
Start with the free spreadsheet above — it's genuinely enough for most traders early on. When the formulas start feeling like a second job, start your free trading journal at TradersJournal.app and bring last week's trades with you. Same habit, one less thing fighting you along the way.