
Trend Following
How does a moving average crossover strategy work?
A moving average crossover trades in the direction a faster moving average crosses a slower one, treating the cross as a signal that the trend regime has shifted. The rules below cover choosing the pair of averages, entry and exit, position management, and why the signal always arrives after the actual turn.
Published September 2, 2026
How it works
It trades the cross, not the trend itself
A moving average smooths price over a fixed lookback. Plot two — one faster, one slower — and the point where the faster line crosses the slower one marks a shift in the average trend: price has, on average, moved further from where it sat over the longer window than the shorter one. The strategy buys when the fast average crosses above the slow one and sells or shorts when it crosses below, treating each cross as a new trend regime rather than trying to call the top or bottom directly.
- 01
Choose a fast and slow average pair and fix it
Common pairs are a 10/50, 20/50, or 50/200 combination of simple or exponential moving averages. The specific lengths matter less than picking a pair and keeping it fixed — changing the lengths after a bad signal is curve-fitting to the past, not a rule.
- 02
Enter on the cross, not before it
Go long when the fast average crosses above the slow average, and go short or exit a long when it crosses below. Anticipating the cross by entering on the approach gives up the confirmation the rule is built to require.
- 03
Place the stop below recent structure, not at a fixed distance
A stop placed under the most recent swing low (for a long) or above the most recent swing high (for a short) ties the risk to what the market has actually done, rather than to an arbitrary point count.
- 04
Exit on the opposite cross or a structural stop, whichever comes first
Hold the position until either the averages cross back the other way or the structural stop is hit. There's no fixed holding period — a crossover system can hold a position for a long stretch if the trend keeps running.
Variants
Other ways to run this
Triple moving average
Adds a third, medium-length average between the fast and slow pair (e.g. 10/20/50) and only takes the cross once all three are stacked in order in the trade direction. Fewer signals than a plain two-average cross, but each one carries more agreement behind it.
Percentage-buffer crossover
Requires the fast average to close a minimum percentage beyond the slow one — not just tick above or below it — before the cross counts. Cuts down on marginal, immediately-reversed crosses in a choppy stretch, at the cost of entering slightly later than a plain cross would.
Volume or momentum-filtered crossover
Only takes a cross that happens on above-average volume, or where RSI confirms momentum in the same direction. Skips crosses that technically fire but have little real participation behind them — a different filter from the percentage-buffer variant, and the two are sometimes combined.
Worked examples
The rules above, on a chart
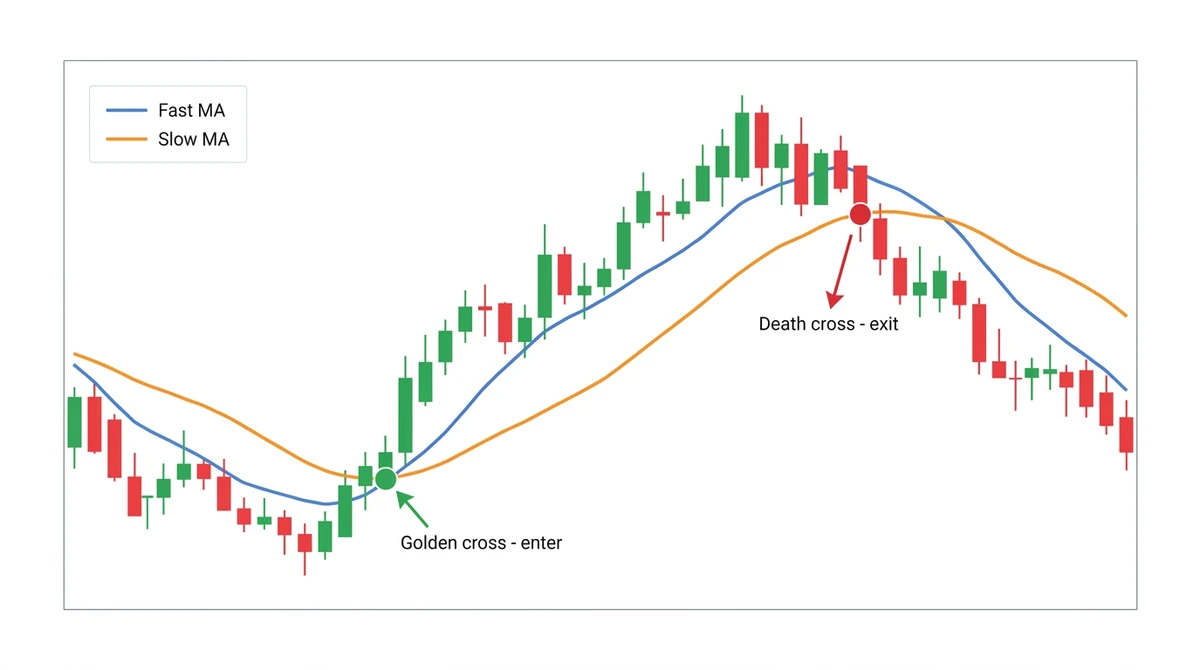
The golden cross and the death cross are the same rule, in opposite directions
One chart, one pair of averages, two signals: the fast average crossing above the slow one (golden cross) is the entry, and it crossing back below (death cross) is the exit. Nothing else changes between the two — same averages, same rule, read in whichever direction it fires.
Illustrative diagram, not a real trade or live price data.
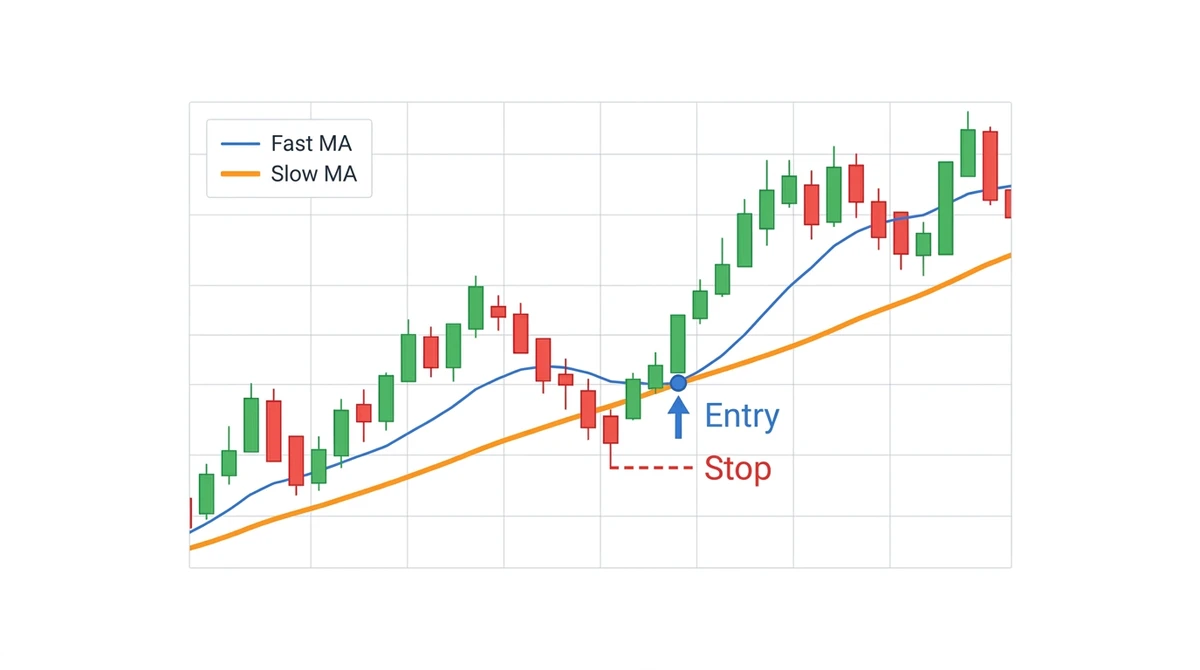
The stop comes from price structure, not from the averages
The cross triggers the entry, but the stop sits below the most recent swing low the price actually made — not at some fixed distance below the averages themselves. Two different jobs: the averages decide when to enter, price structure decides where to get out if it's wrong.
Illustrative diagram, not a real trade or live price data.
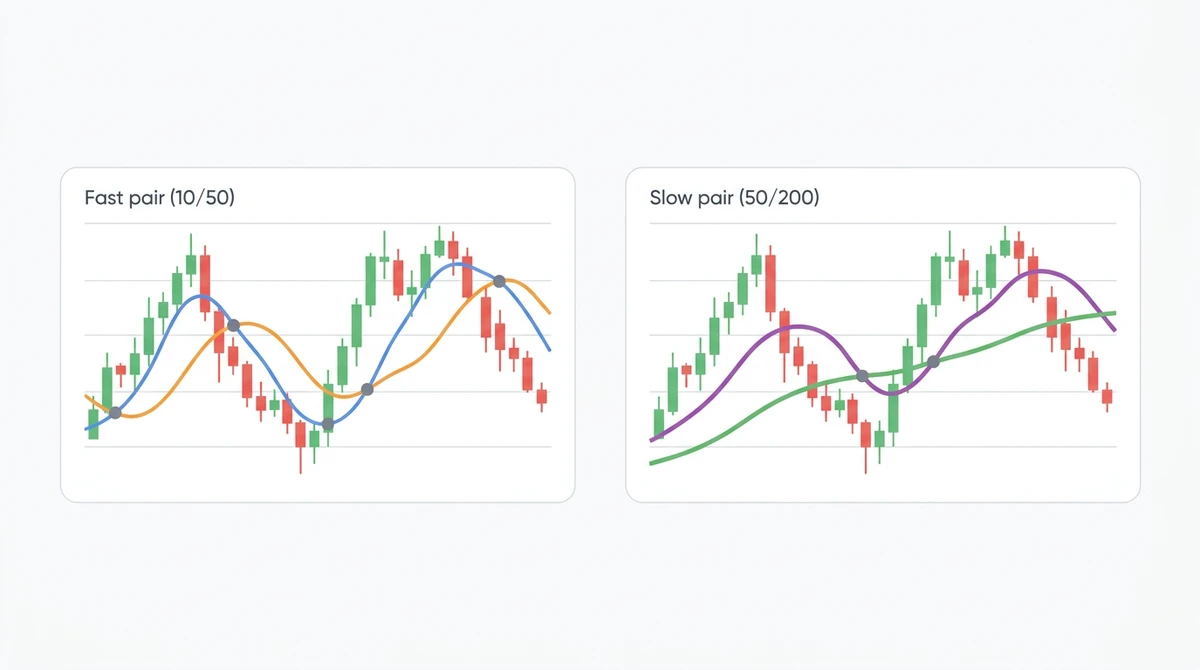
A faster pair fires more often than a slower one, on the same price
Same underlying price move, two different pairs: the 10/50 pair reacts fast enough to cross three times, while the 50/200 pair only registers the move once. Neither reading is wrong — it's the trade-off from the comparison table above, shown on one chart instead of in a row of text.
Illustrative diagram, not a real trade or live price data.
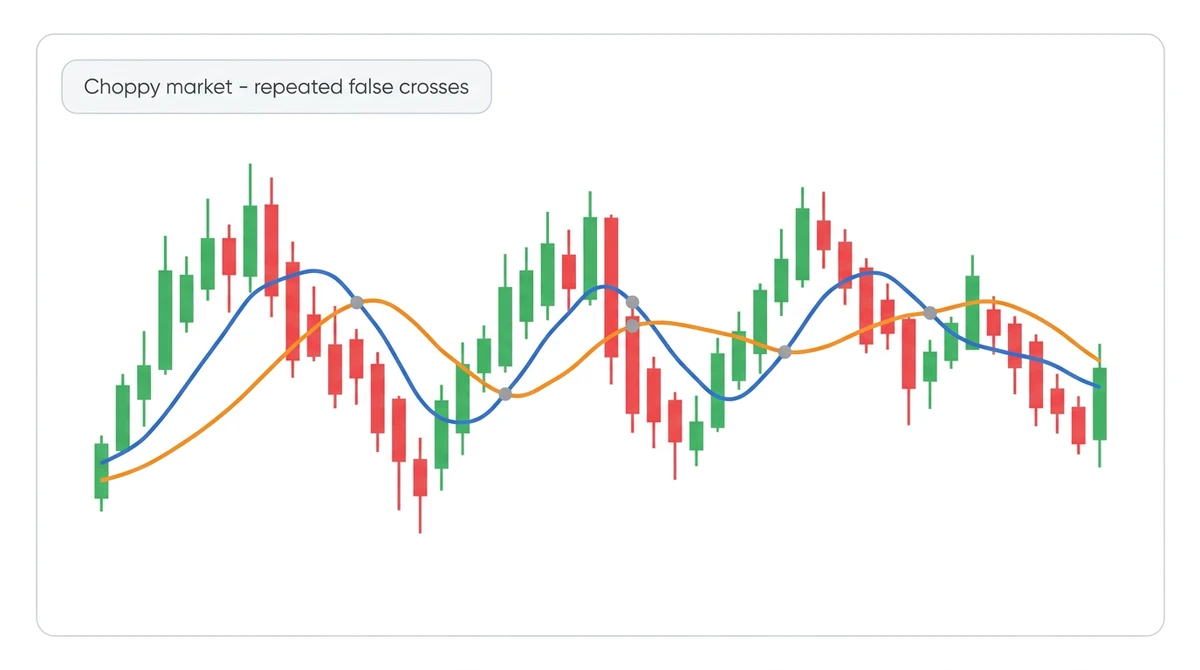
In a range, the same pair just crosses back and forth
No change to the rule — the averages still cross exactly as designed. There's just no trend underneath to reward it, so each cross reverses into the next one before it has room to work, which is what a string of small crossover losses in a range actually looks like on a chart.
Illustrative diagram, not a real trade or live price data.
Common fast/slow pairs, ordered from most reactive to slowest to confirm.
| Pair | Signal frequency | Typically used for |
|---|---|---|
| 10/50 | Frequent — more whipsaw risk in a choppy market | Active swing trading on liquid, trending instruments |
| 20/50 | Moderate — a balance of frequency and lag | General swing trading |
| 50/200 (golden cross / death cross) | Infrequent — only major trend shifts | Position trading and longer-term trend calls |
Position sizing
Risk is set by the stop distance, which moves with volatility
Because the stop sits at a recent swing point rather than a fixed distance, position size has to adjust to keep dollar risk constant: position size = risk amount ÷ (entry price − stop price). On a $20,000 account risking 1% per trade ($200), a cross that enters at $118.50 with a stop at $115.20 — a $3.30-per-share difference — sizes the position at $200 ÷ $3.30, or about 60 shares. A volatile stretch produces wider swings and a wider stop, which calls for a smaller position at the same percentage risk; a quiet stretch does the opposite. Sizing off a fixed share count instead of the stop distance means the actual risk taken varies from trade to trade without the trader choosing that.
Common mistakes
Where this setup usually goes wrong
- 01
Using too short a lookback and trading every wiggle
A fast pair like a 5/10 crosses often in a choppy market, generating a signal on noise rather than an actual regime change. The shorter the averages, the more the strategy needs a genuinely trending market to avoid getting whipsawed.
- 02
Overriding the exit because the trend 'feels' like it will continue
Holding past the opposite cross on a hunch reintroduces the discretion the rule was built to remove, and it's usually done after the trend has already stalled, not while it's strong.
- 03
Ignoring how late the signal actually arrives
By construction, a crossover only fires once the fast average has moved enough to cross the slow one — after a real part of the move has already happened. Expecting an early entry from a lagging indicator sets up disappointment with a rule that was never designed to give one.
- 04
Trading the same pair across every instrument without checking it
A pair tuned to a slow-moving index doesn't necessarily fit a fast-moving single stock or a thin futures contract. The lengths that produce a reasonable signal frequency differ by how much the instrument typically moves.
Limitations
It gives back a chunk of every move and does poorly in a range
A crossover always lags the actual turn, since the fast average has to move enough to cross the slow one first — some of the early move is given up on entry, and some of the profit is given back before the exit signal confirms the trend has ended. In a sideways, range-bound market, the two averages cross back and forth repeatedly with no sustained trend to capture, producing a series of small losses. This strategy needs a market that actually trends for a meaningful stretch to be worth running.
Backtest a crossover pair before trading it live
The right fast/slow pair depends on the instrument and timeframe you actually trade. Backtesting on Traders Journal runs a moving average crossover against historical price data so you can see how a specific pair would have performed before committing to it.
Explore backtestingQuestions
Which moving average crossover is most common: 50/200 or 20/50?
The 50/200 pair — often called the golden cross going up and the death cross going down — is the most widely referenced on daily charts and trades infrequently, aiming for major trend shifts. A 20/50 pair reacts faster and trades more often, better suited to shorter swing timeframes. Neither is objectively better; they trade off signal frequency against lag.
Should I use simple or exponential moving averages for a crossover?
An exponential moving average weights recent price more heavily, so it turns and crosses somewhat sooner than a simple moving average of the same length. That makes exponential pairs a bit more responsive and simple pairs a bit steadier — a real trade-off, not a settled answer, and worth testing against the specific instrument you trade.
Why did the moving average crossover give a signal after the move already happened?
That's a property of the rule, not a malfunction. A crossover only fires once the faster average has moved enough to cross the slower one, which by definition happens after the price shift that caused it. The strategy trades confirmed regime changes, not early turns.
Can a moving average crossover be combined with other indicators?
Yes — a common addition is an RSI or volume filter to skip crosses that happen with weak momentum behind them, or a longer-term trend filter to only take crosses in the direction of the bigger trend. Any addition changes the rule and should be tested as its own version rather than assumed to be an improvement.