
Trend Following
How does the multi-timeframe swing trend strategy work?
Multi-timeframe swing trend uses a higher timeframe to decide the trend direction, then drops to a lower timeframe to time the actual entry — so a swing position is always trading with the bigger trend instead of against it. The rules below cover picking the two timeframes, reading the higher one for direction, timing entries on the lower one, and setting a stop that respects both.
Published September 2, 2026

How it works
One timeframe sets the direction, the other sets the timing
A single chart only ever shows you one resolution of the same argument — this stock is going up, or it isn't. Multi-timeframe swing trend splits that argument across two charts on purpose. A higher timeframe, usually the daily or weekly, answers the direction question: is there a trend here worth joining at all. A lower timeframe, usually the 4-hour or 1-hour, answers the timing question: given that direction, where's a decent place to actually get in. Neither chart is trying to do the other's job. That division is the whole strategy — everything else enforces it.
- 01
Pick both timeframes before you open a single chart
A common pairing is daily for direction and 4-hour or 1-hour for entries — roughly a 6:1 to 24:1 ratio between them is enough separation that the lower timeframe isn't just a zoomed-in copy of the higher one. Write the pair down. Choosing it after you've already seen how the entry timeframe looks defeats the point of having two opinions instead of one.
- 02
Read the higher timeframe for direction only
Check the higher timeframe for a clear trend — a sequence of higher highs and higher lows, or a moving average sloping one way. That's the only question it answers. It doesn't tell you when to enter, and treating a higher-timeframe candle pattern as an entry trigger drags the timing job onto a chart that's too slow for it.
- 03
Only take lower-timeframe setups that agree with the higher one
Once the higher timeframe says up, the lower timeframe is only allowed to offer long setups — a pullback, a break of a short-term swing high, a bounce off a moving average. A short setup on the entry timeframe gets skipped even if it looks clean, because it's arguing with the chart you already decided to trust for direction.
- 04
Trigger the entry off the lower timeframe's own structure
The entry signal — the close beyond a swing point, the reversal candle, the bounce — comes entirely from the lower timeframe. The higher timeframe already did its job by setting which direction is allowed; asking it to also confirm the exact entry candle is asking one chart to do two jobs.
- 05
Set the stop on the entry timeframe's structure, not the trend timeframe's
The stop sits just beyond the swing low or high the entry setup formed on. A stop sized off the higher timeframe's structure is usually too wide for the position size the trade actually calls for — the entry timeframe is what you traded, so it's what should size the risk.
Variants
Other ways to run this
Two-timeframe (the default above)
One direction chart, one entry chart, nothing else. This is the version described in the rules above, and the one to default to — it's the fewest moving parts, which is also why it's the easiest to actually follow under pressure.
Three-timeframe / 'Rule of Three'
Adds a fixed middle chart between the two — direction, then setup, then entry (e.g. weekly, daily, 4-hour). The middle timeframe's only job is spotting the setup pattern (a flag, a pullback zone); the entry timeframe still does the actual triggering. This is a different, deliberately three-chart system chosen upfront — not the same thing as bolting on a third timeframe mid-decision (see Mistakes), which is still wrong even here if it isn't one of the three fixed roles.
Indicator-confirmed
Same two charts, but the direction call on the higher timeframe is gated by an objective rule instead of a visual read — for example, price must be above a rising 50-period moving average, not just 'look trending.' Trades slightly more mechanically and produces fewer discretionary direction calls, at the cost of occasionally missing an early trend the indicator hasn't caught up to yet.
Worked examples
The rules above, on a chart
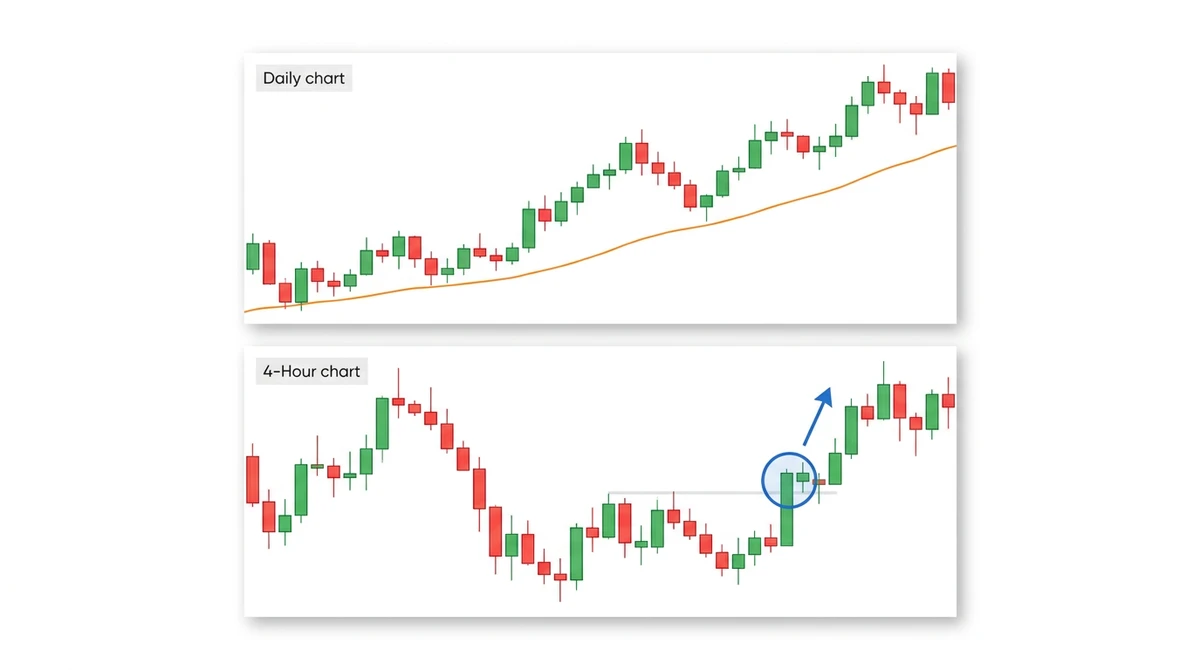
Daily direction, 4-hour entry trigger
The daily panel (top) is only there to answer one question — is this trending up. It is, so the 4-hour panel (bottom) is allowed to look for a long entry. The entry itself — the close above the prior swing high, circled — comes entirely from the 4-hour chart's own structure, not from anything on the daily.
Illustrative diagram, not a real trade or live price data.
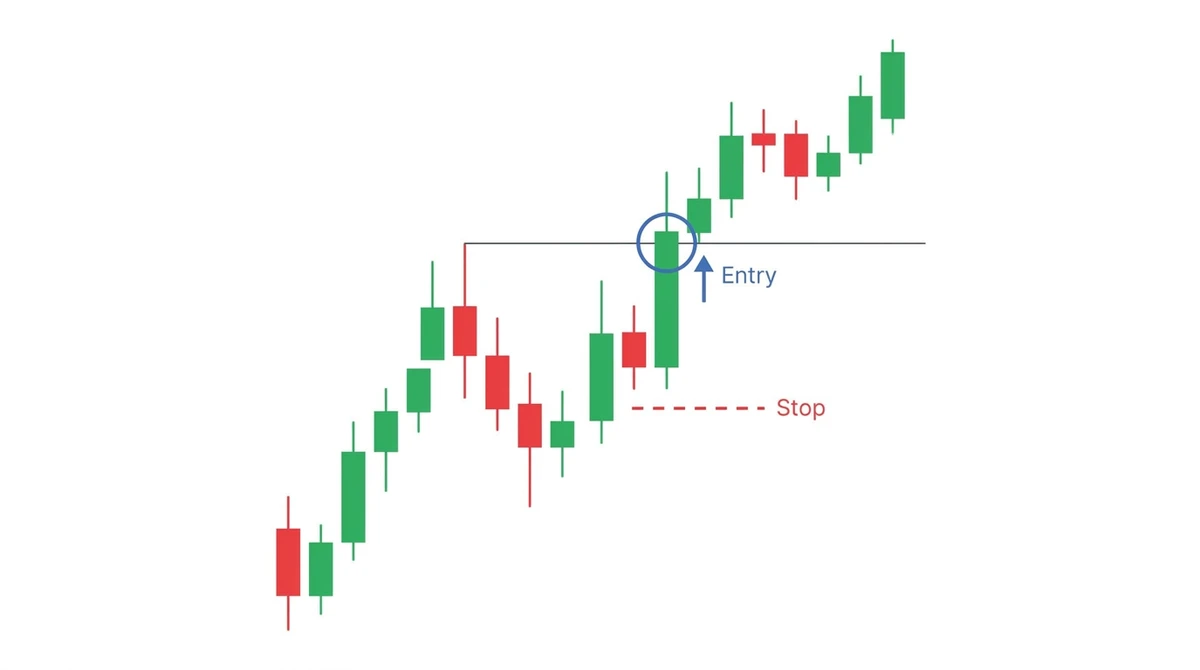
Entry and stop, read off the same chart
Both markers sit on the entry timeframe: the entry triggers on the break of the prior swing high, and the stop sits just under the most recent swing low that formed on that same chart — not under a swing low from the daily panel above, which would size the position off a distance the trade wasn't actually taken on.
Illustrative diagram, not a real trade or live price data.
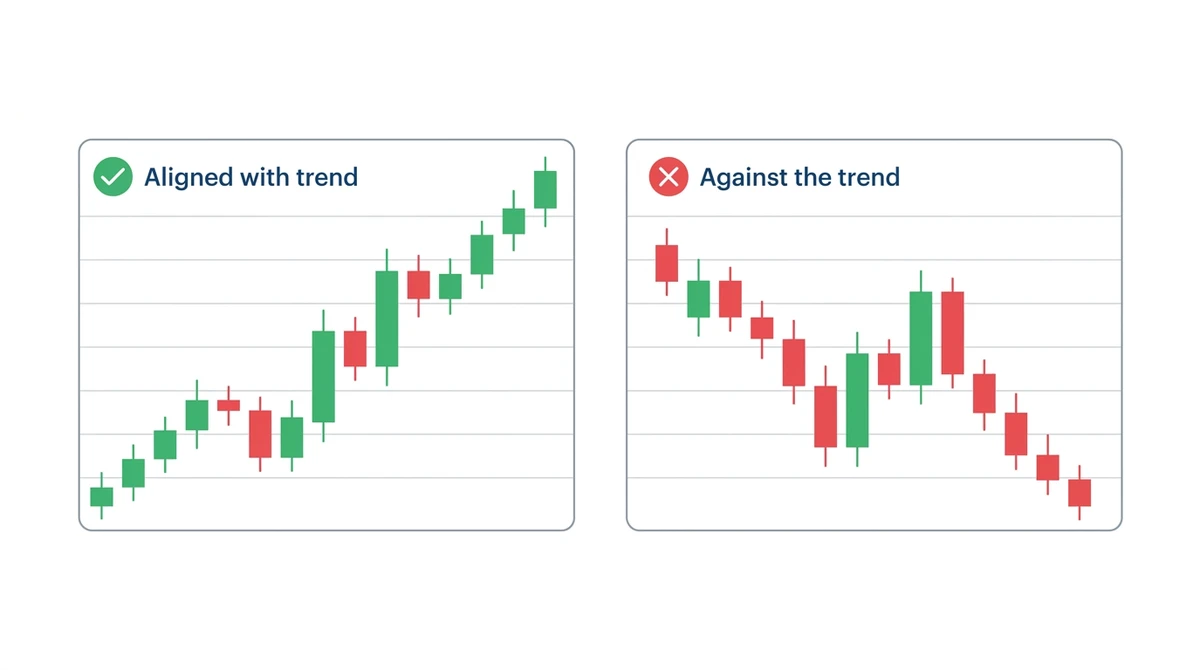
Same-looking setup, two different calls
Both entry-timeframe patterns look identical in isolation. The left one gets taken because the higher timeframe is trending up; the right one gets skipped, not because the pattern is worse, but because the higher timeframe it would be trading against is in a downtrend. The setup never decides this on its own.
Illustrative diagram, not a real trade or live price data.
Common direction/entry timeframe pairings, roughly ordered from position trading down to intraday.
| Direction timeframe | Entry timeframe | Typical ratio |
|---|---|---|
| Weekly | Daily | ~5:1 |
| Daily | 4-hour | ~6:1 |
| Daily | 1-hour | ~24:1 |
| 4-hour | 15-minute | ~16:1 |
Position sizing
The entry timeframe sizes the risk; the trend timeframe just gives permission
Because the stop is anchored to the lower timeframe's own structure, position size is recalculated off that stop distance on each trade, the same as any structure-based stop: position size = risk amount ÷ (entry price − stop price). On a $10,000 account risking 1% per trade ($100), an entry at $52.40 with a stop at $51.10 on the entry timeframe — a $1.30-per-share difference — sizes the position at $100 ÷ $1.30, or about 76 shares. The higher timeframe doesn't add its own risk parameter — it either gives permission to look for an entry or it doesn't. A trader who also tries to size risk off the higher timeframe's wider swings ends up with a stop that doesn't match the chart the trade was actually taken on, and a position size calculated off the wrong distance.
Common mistakes
Where this setup usually goes wrong
- 01
Switching which timeframe means what, mid-decision
Treating the 4-hour as the direction chart on one trade and the entry chart on the next, depending on which one currently agrees with what you want to do, isn't multi-timeframe trading — it's picking whichever chart supports the trade you already wanted.
- 02
Bolting on an extra timeframe mid-decision, for reassurance
Pulling up a third chart on a trade you're already unsure about, hoping it breaks the tie, isn't the same as deliberately running a fixed three-timeframe system (see Variants). Reassurance-shopping adds a chart that occasionally disagrees with the other two, at which point the trade gets skipped for a reason that has nothing to do with the original setup.
- 03
Taking an entry-timeframe setup that fights the higher timeframe
A textbook reversal pattern on the 1-hour is still a countertrend trade if the daily is trending the other way. The setup being clean on its own chart doesn't override the direction rule the strategy is built around.
- 04
Re-checking the higher timeframe after every candle on the lower one
The higher timeframe's trend doesn't change every hour — checking it constantly invites second-guessing a direction call that was supposed to be settled before the entry search even started.
Limitations
It needs a real trend on the higher timeframe, and it adds a second chart to manage
If the higher timeframe is genuinely sideways, there's no direction to hand down to the entry timeframe, and forcing the pairing anyway just means trading the lower timeframe's noise with an extra step attached. It also takes more screen time and discipline than trading one timeframe alone — missing the higher-timeframe context on a trade that's already been entered is a real, common failure mode, not a hypothetical one.
Backtest your timeframe pairing before trading it live
Which two timeframes you pair, and how wide a ratio between them counts as 'enough separation,' change results more than most traders expect. Backtesting on Traders Journal lets you run a specific pairing against historical data across both charts, so you're testing a defined rule instead of a hindsight-fitted combination.
Explore backtestingQuestions
What's the best timeframe combination for multi-timeframe swing trading?
Daily for direction with 4-hour or 1-hour for entries is the most common swing pairing, but there's no single correct combination — what matters is that the two timeframes sit far enough apart that the lower one isn't just a zoomed-in copy of the higher one. Fix the pair before you start looking for trades, not after.
How many timeframes should I actually use?
Two. One for direction, one for entry timing. Adding a third rarely adds useful information and usually just adds another chart that can disagree with the other two, which tends to talk traders out of otherwise valid setups.
Does multi-timeframe analysis actually reduce false signals?
It filters out entry-timeframe setups that go against the bigger trend, which removes a category of low-quality countertrend trades. It doesn't make the remaining setups guaranteed winners — the entry timeframe can still be wrong even when it agrees with the higher one.
Should the stop be based on the higher timeframe or the entry timeframe?
The entry timeframe. That's the chart the trade was actually taken on, and its structure is what the stop and position size should be measured against. A stop sized off the higher timeframe's wider swings is usually too loose for the position the entry timeframe justifies.
What if the higher timeframe and lower timeframe disagree?
Skip the trade. The strategy's entire premise is trading in the direction the higher timeframe already confirmed — an entry-timeframe setup that fights that direction is a signal the strategy is specifically built to filter out, not an exception worth making.