
Trend Following
How does the trendline trading strategy work?
A trendline trading strategy draws a line under rising swing lows or over falling swing highs, then trades one of two things that line does next: holds and bounces price back in the trend's direction, or breaks and price keeps going through it. The rules below cover drawing a trendline that means something, the bounce and break setups, and where the stop goes for each.
Published September 3, 2026

How it works
One line, two different trades
A trendline connects at least two swing lows in an uptrend or two swing highs in a downtrend, projected forward as a level the market keeps reacting to. Everything about the strategy depends on what happens when price returns to that line: if it holds, that's a bounce, traded in the trend's direction; if it closes through, that's a break, traded once the old trendline is retested as the opposite kind of level. Both setups use the same line for opposite reasons, and most trendline losses trace back to one mix-up: trading a break like it's a bounce, or the other way round.
- 01
Draw the trendline from at least two touches, then wait for a third
Connect the two most recent swing lows (uptrend) or swing highs (downtrend) to draw the line. Two points define it, but a third touch that respects the line is what separates a real trendline from a line that happens to fit the last two candles by coincidence. Don't trade off a trendline that's only been touched once.
- 02
Trade the bounce in the direction of the trend
When price returns to a trendline that's held twice already, look for a reaction at the line itself — a rejection candle, a stall in momentum — before entering in the trend's direction. The stop goes just beyond the trendline, on the outside of the trend. If price closes through instead of holding, the bounce trade is off.
- 03
Trade the break only after a retest, not on the first close through
A close beyond the trendline is a break, but the higher-probability entry is the retest: price returns to the broken line from the other side and it now acts as the opposite kind of level (old support becomes resistance, or the reverse). Enter on a rejection at the retest, with the stop back on the far side of the trendline.
- 04
Redraw the trendline the moment structure changes
A trendline is a description of the swings that formed it, not a fixed feature of the chart. Once a new swing high or low prints, redraw from the most recent relevant points rather than keeping the original line and forcing new price action to fit it.
Variants
Other ways to run this
Trendline bounce
The trend-following version: enter in the direction of the existing trend each time price returns to the line and holds. Works best while the trend is intact and the line keeps getting respected — it produces more trade opportunities than the break version but each one carries the risk that this is the touch where the line finally gives way.
Trendline break and retest
The reversal-or-acceleration version: wait for a confirmed close beyond the trendline, then enter on the retest rather than the initial break. Fewer signals than the bounce version, but each one comes with the retest as a built-in confirmation step the bounce trade doesn't have.
Worked examples
The rules above, on a chart
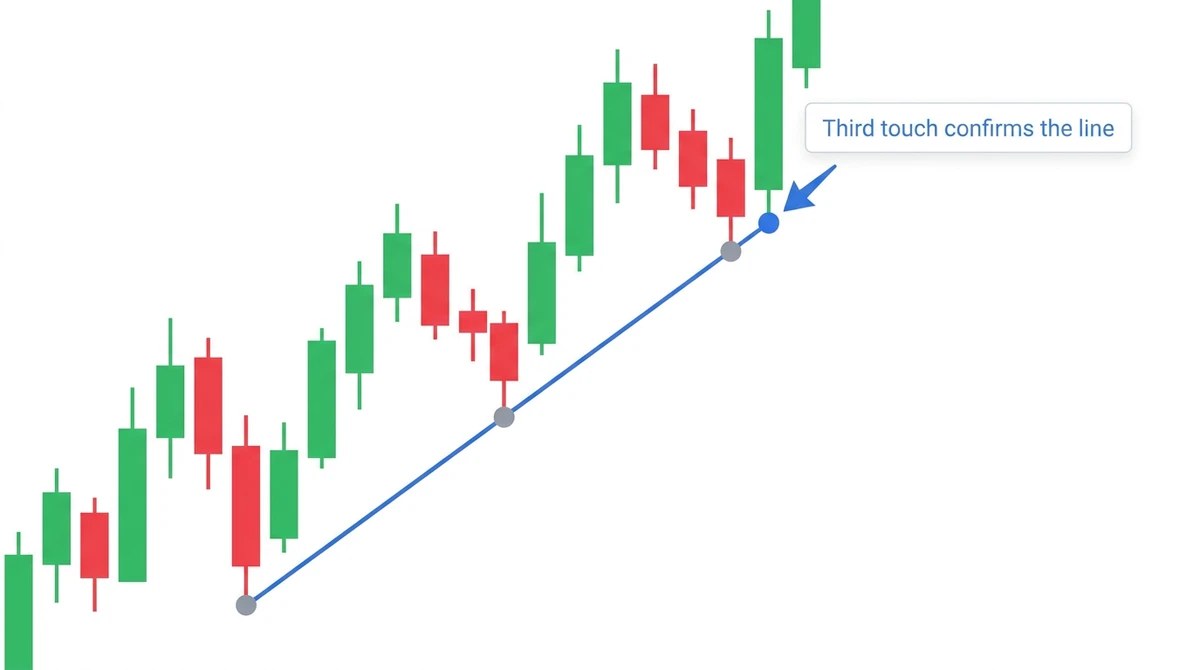
Two touches draw the line, but the third is what makes it tradeable
The first two swing lows draw the line, but nothing has happened yet — a line through two points fits almost any two points. It's the third touch, where price returns and holds again, that shows the line is describing something the market is actually respecting rather than a coincidence of the last two candles.
Illustrative diagram, not a real trade or live price data.
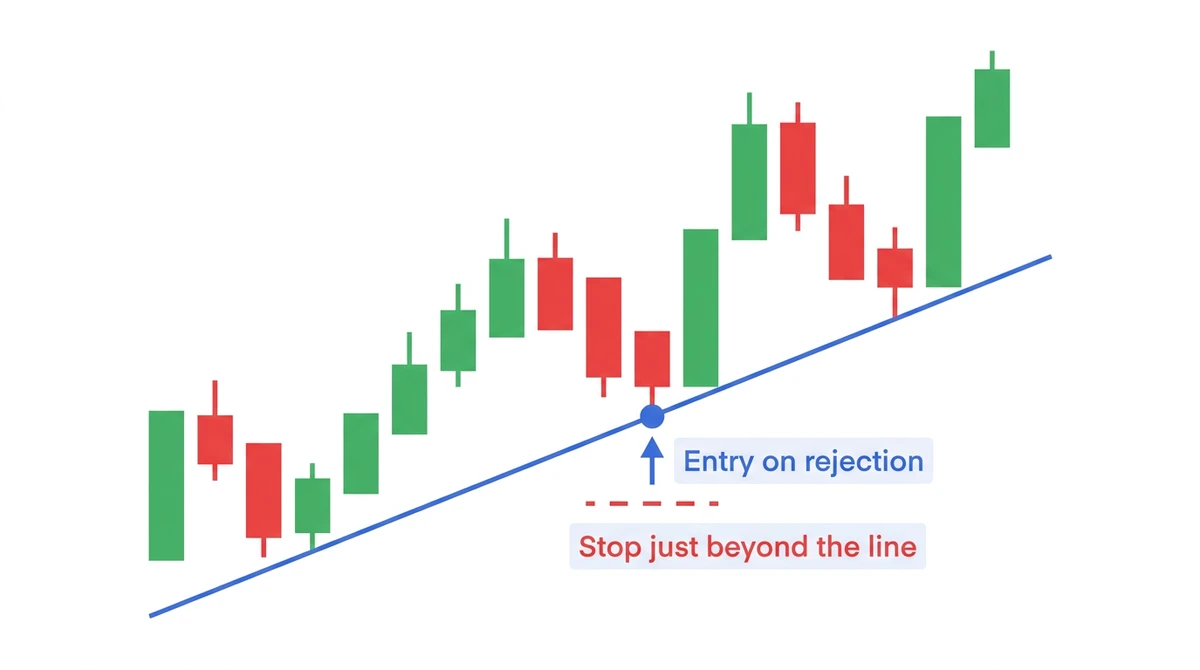
The bounce trade: entry on the rejection, stop just beyond the line
Price returns to a trendline that's already held twice, prints a rejection candle, and that's the entry — in the direction of the trend. The stop sits just beyond the line itself, on the outside of the trend, so a close through it is the same signal that says the bounce trade was wrong.
Illustrative diagram, not a real trade or live price data.
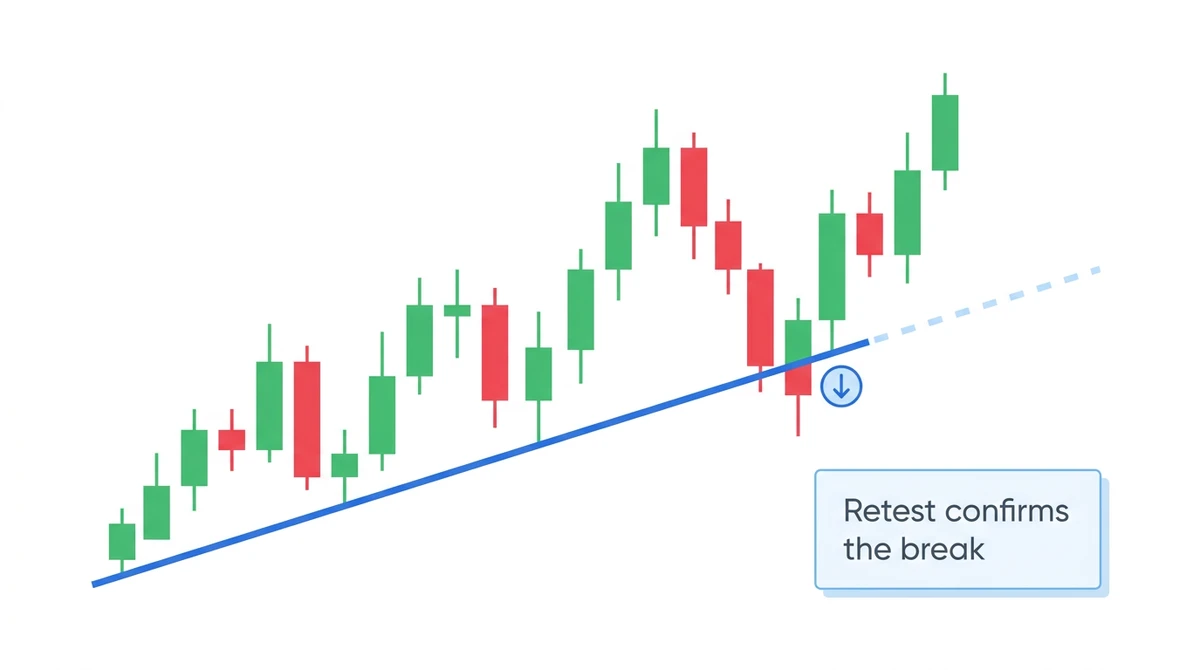
The break trade waits for the retest, not the first close through
Price closes beyond the trendline — a break — but the entry isn't there yet. It comes when price returns to that same line from the other side and gets rejected, confirming the old line has flipped from support to resistance (or the reverse). The stop goes back on the far side of the retested line.
Illustrative diagram, not a real trade or live price data.
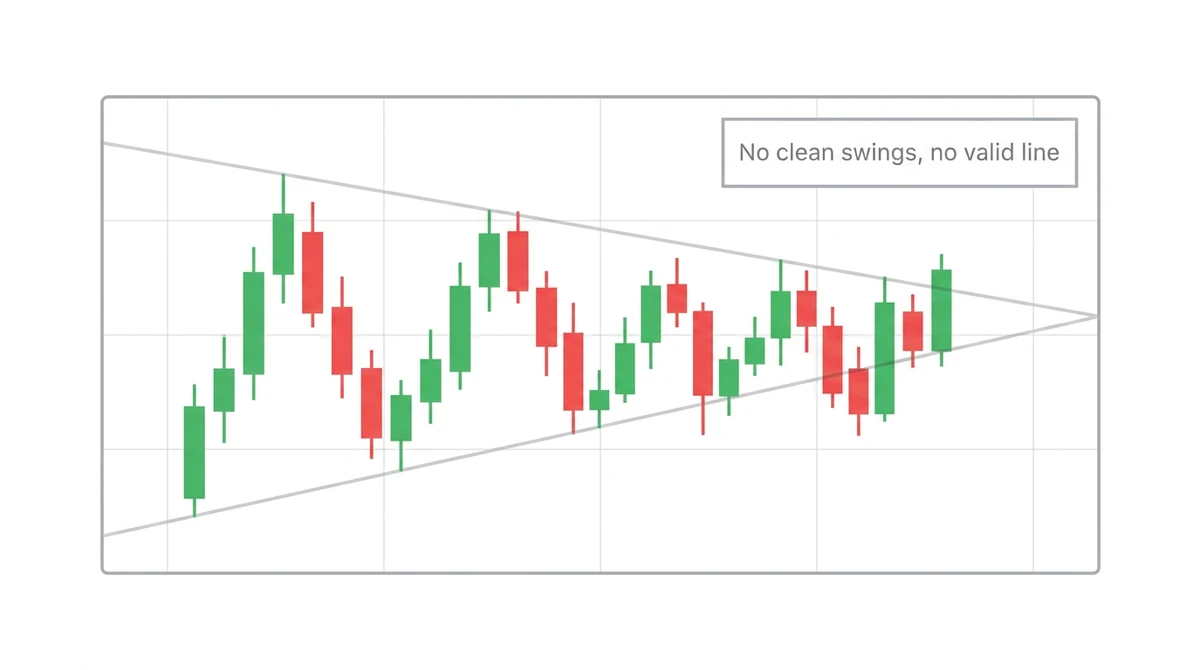
A choppy market gives you no clean swings to connect
Without a real sequence of higher lows or lower highs, any line drawn through the chop is arbitrary — two different traders could draw two different lines and both could argue for theirs. This is the strategy's core limitation, not a mistake in execution: there's no fix for a market that isn't trending, only the discipline to not force a line onto one anyway.
Illustrative diagram, not a real trade or live price data.
Bounce vs. break — what each version needs before you're in
| Trendline bounce | Trendline break and retest | |
|---|---|---|
| Trades with the trend? | Yes | Only after the trend has broken |
| Entry trigger | Rejection at the line | Rejection at the retest |
| Confirmation before entry | Prior touches held | Close beyond the line, then a retest |
| Stop placement | Just beyond the trendline | Beyond the retested trendline |
| Signal frequency | Higher — one per touch | Lower — one per genuine break |
Position sizing
The stop distance is whatever the trendline says it is, not a fixed number
Because the stop sits just beyond the trendline itself, its distance changes trade to trade with how steep the line is and how far price has moved from it. Size the position off that actual distance every time: position size = risk amount ÷ (entry price − stop price). On a $10,000 account risking 1% per trade ($100), a bounce entry at $54.20 with a stop at $52.80 — a $1.40 difference — sizes the position at $100 ÷ $1.40, or about 71 shares. A steep trendline gives a tight stop and room for a larger position at that same dollar risk; a shallow, wide trendline forces a smaller position. Recalculate size off the actual stop distance each time rather than reusing whatever worked on the last trade.
Common mistakes
Where this setup usually goes wrong
- 01
Forcing a line through price that doesn't actually touch it
Angling a trendline to connect wicks or closes that don't line up, just to make the chart show a trend, produces a level with no real basis for holding. If the line needs bending to fit, it isn't a trendline — it's a wish.
- 02
Trading the first touch as if it were the third
Two points make a line, but they don't make it valid. Entering on the very first return to a freshly drawn trendline skips the confirmation a third touch provides and turns the trade into a guess about a line that hasn't proven anything yet.
- 03
Entering a break on the first close through, with no retest
A single close beyond the trendline can still fail and snap back. Entering immediately, instead of waiting for the retest to confirm the old line now behaves like the opposite kind of level, gives up the one piece of confirmation the break setup is built around.
- 04
Keeping the same trendline after structure has clearly changed
A trendline drawn off swings from weeks ago stops describing the current trend once new swings have formed closer to price. Trading off a stale line instead of redrawing it means reacting to a level the market has already moved past.
Limitations
It needs clean swings, and it disagrees with itself when it doesn't have them
In a choppy, sideways market there are no clean sequences of higher lows or lower highs to connect, so any trendline drawn is arbitrary and the bounce/break distinction stops meaning anything. Trendline reading is also genuinely subjective — hand the same chart to two traders and you'll get two different lines — which is exactly why the strategy leans on multiple touches and a retest instead of a single line and a hunch.
Backtest your trendline rules before trading them live
Where you draw the line and how many touches you require before trusting it both change results a lot, and both are decisions best tested against history rather than guessed at live. Backtesting on Traders Journal lets you run a specific trendline rule set against historical data so you're testing a defined setup, not a line you liked the look of.
Explore backtestingQuestions
How many touches does a trendline need before it's valid?
Two points draw the line, but most traders wait for a third touch that respects it before treating it as real. A line that's only been touched once hasn't demonstrated anything yet — it's a guess about where the next swing might land.
What's the difference between a trendline bounce and a trendline break?
A bounce trades in the direction of the existing trend, entering when price returns to the line and holds. A break trades once price closes beyond the line, entering on the retest that follows rather than the initial close through.
What timeframe works best for trendline trading?
The mechanics work on any timeframe, but higher timeframes (4-hour and daily) tend to produce cleaner swings and more reliable trendlines with fewer false touches. Lower timeframes trade more often but with noisier, less dependable lines.
Are trendline breakouts reliable?
Not on their own — a close beyond a trendline can still fail and snap back, which is why the break setup waits for a retest rather than entering on the first close through. The retest is what turns a possible break into a confirmed one.
Can beginners use a trendline trading strategy?
The concept is simple to learn, but drawing a trendline is somewhat subjective, and inconsistent drawing is the most common source of bad signals for anyone new to it. Writing down a fixed rule for what counts as a valid touch, before looking at any specific chart, removes most of that inconsistency.