
ICT & Smart Money
What is an order block in trading?
An order block is the last opposing candle before price moves away hard in the other direction. Traders mark it as the zone where the move actually started, on the idea that whoever pushed price that far probably left orders behind at that level.
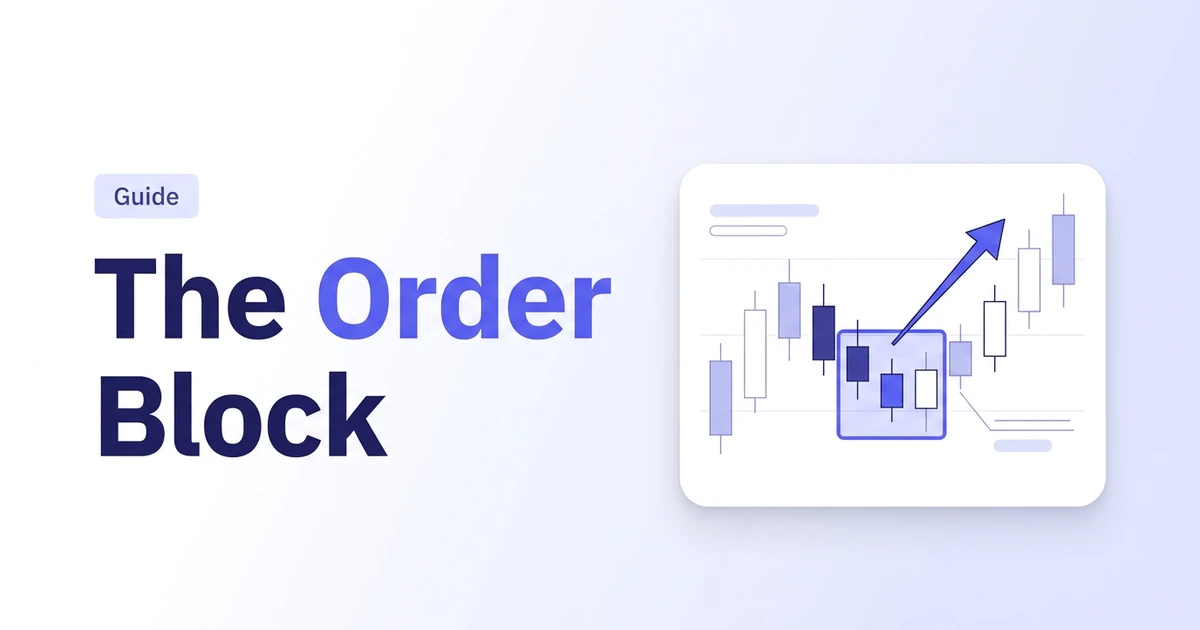
What it is
An order block is the candle that stood in front of the move
Look at any sharp directional move and walk backward from it. The order block is the final candle that closed against that move, right before displacement took over. In a bullish move, that's the last down candle before price rips higher. In a bearish move, it's the last up candle before price drops. The name comes from the idea that big buy or sell orders were absorbed at that candle's level, and the strong move that followed is evidence something changed hands there. Nothing about the definition requires you to know who traded it or why — it's a mechanical read of one candle relative to the move that followed it, which is exactly what makes it something you can mark consistently.
- 01
Find the displacement first, then work backward
An order block only exists because of the move that follows it. Start by spotting a candle or short run of candles that covers noticeably more range than what came before — that's the displacement. The order block is the last opposing candle sitting right in front of it.
- 02
Check that the candle actually opposes the move
For a bullish order block, the candle must close red (or at least fail to make a higher close) before the up-move starts. For a bearish order block, it must close green before the down-move starts. A candle in the same direction as the move that follows isn't an order block.
- 03
Mark the full candle range as the zone
The zone runs from the candle's high to its low, not just the body. Some traders trim it to the body on the theory that wicks are noise, but the more common convention keeps the full range and treats the body as the tighter, higher-confidence area inside it.
- 04
Confirm the move broke structure
A genuine order block is usually followed by a break of the prior swing high or low, not just a fast candle that stalls out. Displacement without a structure break is often just volatility, not evidence that a level matters.
- 05
Record the timeframe you found it on
A 5-minute order block and a daily order block are the same idea at very different scales. The daily one will hold weight for weeks; the 5-minute one can be irrelevant an hour later. Note the timeframe every time so you're not comparing zones that were never equivalent.
Variants
Other ways to run this
Bullish and bearish order blocks
The base pair. A bullish order block is the last down candle before a strong push higher, watched as potential support on a retrace. A bearish order block is the last up candle before a strong push lower, watched as potential resistance. Everything else in this section is a variation on one of these two.
Breaker block
An order block that failed — price returned to it, broke straight through, and later came back to retest it from the other side. A bullish order block that gets broken down through becomes a bearish breaker block, and traders who track them treat the failure itself as information: the level that used to hold supply or demand flipped, so they watch the retest for a reaction in the new direction instead of the old one.
Mitigation block
An order block that price returns to and trades through partially, without a full breaker-style reversal. The zone is considered 'mitigated' — partially used up — after that first touch, and traders who distinguish it from a fresh, untouched order block generally treat the mitigated version as weaker on any second visit.
How to read it
The zone marks where the move began, not where it ends
An order block tells you where a strong directional move originated. That's a location worth watching, not a forecast. The common read is that price often returns to test that origin before continuing in the original direction, so traders use an untouched order block as a place to look for an entry when price retraces into it, with the far edge of the zone as a natural stop-loss reference. How often that hold actually happens depends heavily on the timeframe, how strict your displacement and structure-break criteria are, and the instrument you're trading — 'often' is carrying a lot of weight in that sentence, and it means something different on every chart. The order block gives you a candidate zone. Whether that zone earns a reaction on your market is a question for your own data, not a rule you get to inherit.
Worked examples
The read above, on a chart
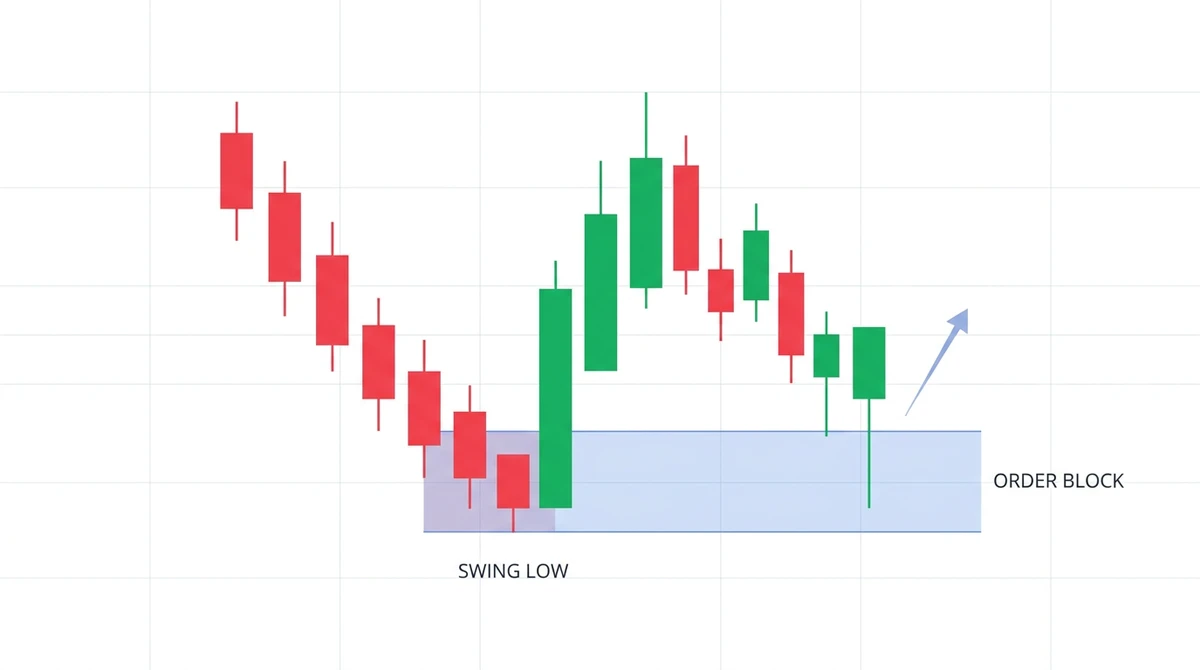
Bullish order block holding on a retrace
Price prints a sequence of down candles into a swing low, where the final red candle is followed immediately by strong upward displacement that breaks prior swing structure. Marking that final down candle defines the bullish order block zone. When price subsequently pulls back into the zone, it finds responsive buying without closing below the low, confirming the zone's hold and driving a resumption higher.
Illustrative diagram, not a real trade or live price data.
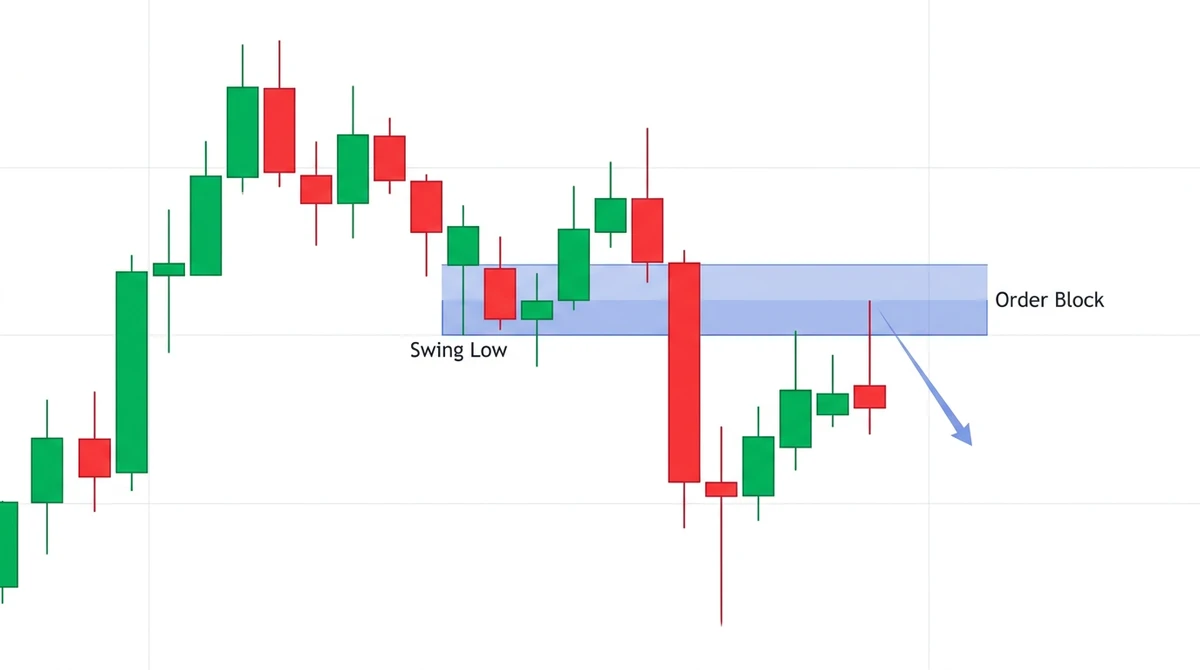
Bearish breaker block failing and flipping to resistance
An order block formed at a swing low is expected to act as support. On the next decline, however, price does not hold — aggressive selling drives a candle close straight through the zone, breaking market structure lower. When price subsequently retraces back up to test the underside of the broken zone, the former support level flips to resistance, triggering rejection and continuation to the downside.
Illustrative diagram, not a real trade or live price data.
Order blocks sit alongside a handful of concepts traders regularly confuse them with. They describe different things even when they show up on the same chart at the same time.
| Concept | What it actually marks | How it's defined |
|---|---|---|
| Order Block | The last opposing candle before a strong move | One candle, judged against the displacement move that follows it |
| Fair Value Gap | The untouched space a fast move left behind | Three candles, measured wick-to-wick across the central candle |
| Breaker Block | An order block that failed and flipped roles | Same zone as an order block, redefined after price breaks through and retests |
| Mitigation Block | An order block revisited without a new extreme | A retested zone where positions are balanced, weakening future visits |
| Support / Resistance | A price level tested multiple times | Repeated swing highs or lows, with no single-candle displacement criteria |
Limits
What an order block does not tell you
It does not guarantee a reaction. Plenty of order blocks get run straight through with no pause at all, and the definition has no built-in filter for which ones will hold. It does not tell you timing — a zone can sit untouched for a day or get retested within the hour, with nothing in the definition constraining either. It does not confirm who actually traded there; 'institutional footprint' is an interpretation layered on top of a mechanical candle pattern, not something the chart proves, no matter how confidently it gets said in a YouTube thumbnail. And on low timeframes, order blocks are common enough to be nearly meaningless on their own — which is why most traders pair them with a structure break, a minimum displacement size, or a higher-timeframe bias before treating one as worth acting on. That filter is the part that actually does the work.
Test the zone before you trust it
Marking order blocks on a chart you've already seen play out proves nothing — hindsight makes everyone a smart-money trader. Traders Journal's backtesting steps through history bar by bar, so you can mark every order block the rule would have caught and record whether it actually held — including the ones that didn't — instead of relying on memory.
Explore backtestingQuestions
What is an order block in trading?
An order block is the last candle that closed against a strong directional move, right before that move started. In a bullish move it's the last down candle beforehand; in a bearish move it's the last up candle. Traders mark the candle's range as a zone and watch whether price returns to it later.
What is the difference between a bullish and bearish order block?
A bullish order block is the last down candle before a strong push higher, watched as potential support on a pullback. A bearish order block is the last up candle before a strong push lower, watched as potential resistance on a rally. Both are read the same way — as the origin of the move, not a signal by themselves.
How do you identify a valid order block?
Start from the displacement move, not the candle. Find a run of candles that covers noticeably more range than what preceded it, then walk back to the last candle that closed against that move. Confirm the move that followed broke the prior swing high or low, and note the timeframe — a valid order block on a 5-minute chart and one on a daily chart carry very different weight.
Should I mark an order block using the candle body or the full wick?
The standard practice marks the entire range from high wick to low wick to ensure the complete absorption area is captured. However, many traders treat the candle body (open to close) as the high-conviction core of the zone and use wicks as buffer or invalidation boundaries.
What is the difference between an order block and a fair value gap?
They mark different things from the same move. An order block is a single candle — the last one opposing the move before it happened. A fair value gap is the empty space the move itself left behind, measured across three candles. They often sit near each other on the chart, but one is defined by a candle and the other by an absence of trading.
What is the difference between an order block and a supply and demand zone?
Supply and demand zones typically encompass multiple consolidation candles or basing ranges where price paused before breaking out. An order block is more granular: it specifically isolates the single final opposing candle immediately preceding the displacement impulse.
What is a breaker block?
A breaker block is an order block that failed. Price returned to the zone, closed straight through it instead of holding, and later revisited it from the other side. Traders who track breaker blocks treat the failure as a role flip — a bullish order block that gets broken down through becomes a bearish breaker block, watched for resistance rather than support on the next visit.
What is a mitigation block?
A mitigation block is an order block that price returns to and trades into without creating a new swing extreme. The retest partially mitigates or exhausts remaining orders. Traders generally consider subsequent retests of a mitigated zone to have lower probability than the initial virgin touch.
What timeframes work best for order blocks?
Order blocks are fractal and appear on all timeframes, but higher timeframes (such as 4-hour, daily, or weekly) carry significantly greater structural reliability. Lower timeframe order blocks (such as 1-minute or 5-minute) are prone to market noise and work best when aligned with higher-timeframe trend and key liquidity pools.
Why do order blocks fail?
Order blocks fail when counter-trend momentum is stronger than anticipated, when higher-timeframe market structure overrides the local level, or during major macroeconomic news catalysts. In addition, an order block lacking true displacement or a clean break of structure often represents normal chop rather than genuine institutional participation.
Does Traders Journal have an order block indicator?
Yes. Order blocks are one of the built-in ICT studies available in the charts and backtesting workspace, so bullish and bearish zones are marked automatically as you step through price history.