How to backtest a trading strategy, in short: write your entry, exit, stop, and position rules down first, pick a market and enough historical data, run those fixed rules against the data, log every signal, and read the results together. You do not need to learn Pine Script or Python to do any of it — you need fixed rules, historical data, and a way to run the two against each other without lying to yourself halfway through.
Here's the five-step version, then the honest detail behind each step — including where most traders quietly skip one and wonder later why the number at the end didn't hold up live.
How to Backtest a Trading Strategy (Quick Answer)
- Write your entry, exit, stop, and position-size rules down before you look at a single chart.
- Pick a market, timeframe, and at least a few years of historical data.
- Run it — manually with bar replay, or with software that replays the data for you. No code required.
- Log every signal the rules generate, wins and losses both.
- Read win rate, risk-to-reward, drawdown, and losing streaks together, not one number in isolation.
That's it. No hidden sixth step, no secret metric. What separates a backtest that means something from one that's just decoration is whether each of these five actually happened, in order, before the rules got bent to fit what already worked.
Before You Start: What a Real Backtest Needs
Look — most "I backtested this" claims fall apart under one question: were the rules written down before you looked at the data, or after? If the answer is after, you didn't backtest anything. You found a pattern in hindsight and gave it a confident name.
A real backtest needs three things in place before you run it:
- Fixed rules. Entry trigger, exit trigger, stop loss, position size — all written down, all specific enough that two different people running them would take the same trades.
- Matching data. The market and timeframe you plan to actually trade, not whatever chart happened to be open.
- Enough history. A few years minimum, covering more than one type of market — a strategy tested only on a strong uptrend hasn't been tested, it's been flattered.
Skip any of the three and you can still run the test. You just won't be able to trust what comes out of it.
One honest note before Step 1: a backtest can only ever prove that a rule set had evidence in the past. It cannot promise the same edge shows up going forward — markets change as the people, technology, and conditions behind them change. That's not a reason to skip backtesting. It's the reason a passed backtest is a starting point and not a finish line, which gets covered properly further down.
Step 1: Write Your Rules Down, Exactly
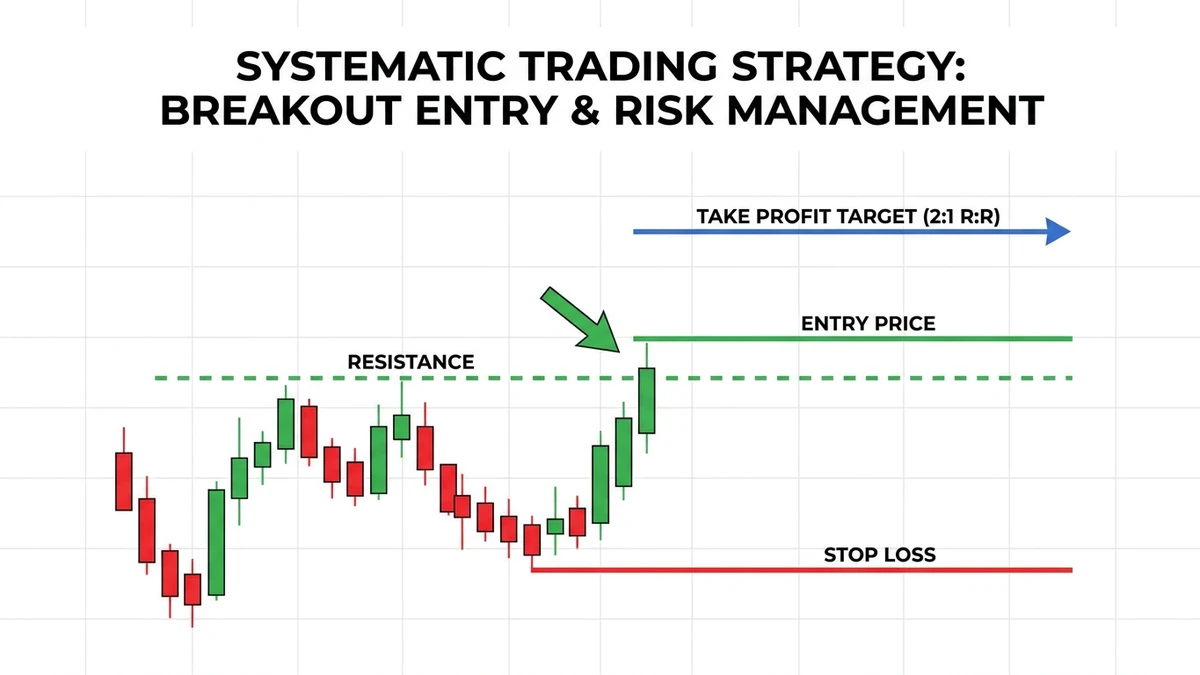
"Buy near support" is not a rule. "Buy when price closes above the 20 EMA on the 15-minute chart after touching the prior day's low" is a rule. The difference is whether it survives being handed to someone else with no other context.
Write down all four parts before you touch any historical data:
- Entry condition — the exact trigger, not a feeling.
- Exit condition — where you take profit, stated as a level or a rule, not "when it feels right."
- Stop loss — where you're wrong, decided in advance.
- Position size — how much you risk per trade, as a fixed percentage or amount.
Whether your strategy trades retests at a high-timeframe order block, imbalances inside fair value gaps, or a mechanical swing structure breakout, the trigger cannot be discretionary during testing. It has to be an objective condition you can verify bar by bar.
Random entries on old charts are still random entries. They're just wearing a spreadsheet now, which makes them look more official than they are.
Step 2: Pick Your Market, Timeframe, and Data Range
Match the data to how you actually plan to trade. Testing 5-minute scalps against daily candles is not a shortcut — it's a different strategy wearing the name of the one you meant to test.
Use as much history as you reasonably can, aiming for a few years where possible. A strategy needs to face trending, ranging, volatile, and quiet markets before it earns any trust. Three good months of a strong uptrend will flatter almost any trend-following idea — that's not a compliment to the strategy, it's just what uptrends do to anything pointed the right direction.
Where the data comes from matters too. A broker's own trade history export only shows what you already traded, not every signal your rules would have flagged — it's a record of your decisions, not a test of your rules. A charting platform's historical candles, or a dedicated backtesting tool with its own stored data, gets you the full signal list instead of just the trades you happened to take live.
Manual vs. Software Backtesting: Which One Fits Your Strategy
There are really three ways to run Step 3, and none of them require you to already know how to code.
| Method | Best for | Coding needed |
|---|---|---|
| Spreadsheet, manual entry | Fully mechanical rules with a handful of historical trades already logged | None, but slow and easy to enter data wrong |
| Bar replay | Discretionary or judgment-based setups, and anyone learning a new setup | None |
| Coded strategy tester | Fully mechanical rules where you want hundreds of trades tested in minutes | Pine Script, Python, or similar |
A spreadsheet works, technically, for a handful of trades — but it doesn't scroll through history for you, so you're still manually finding every signal before you type it in. Bar replay does that scrolling for you and keeps the human judgment a discretionary setup needs. A coded tester trades speed for a requirement most traders don't have and don't need: writing and debugging a script just to find out if a moving-average crossover made money.
If your rules genuinely are just "cross, breakout, threshold" with nothing discretionary in them, coding pays off once you want thousands of trades tested at once. For everyone else, bar replay gets you a real answer without the detour through a programming language you'll only ever use for this one thing.
Step 3: Run It Without Writing a Line of Code
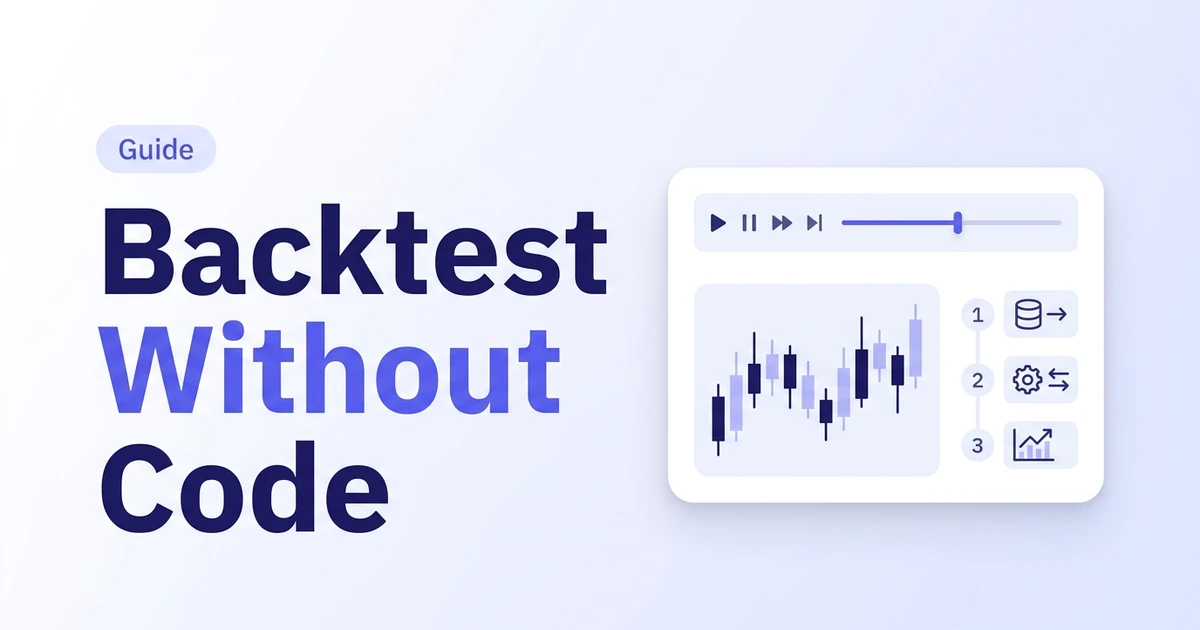
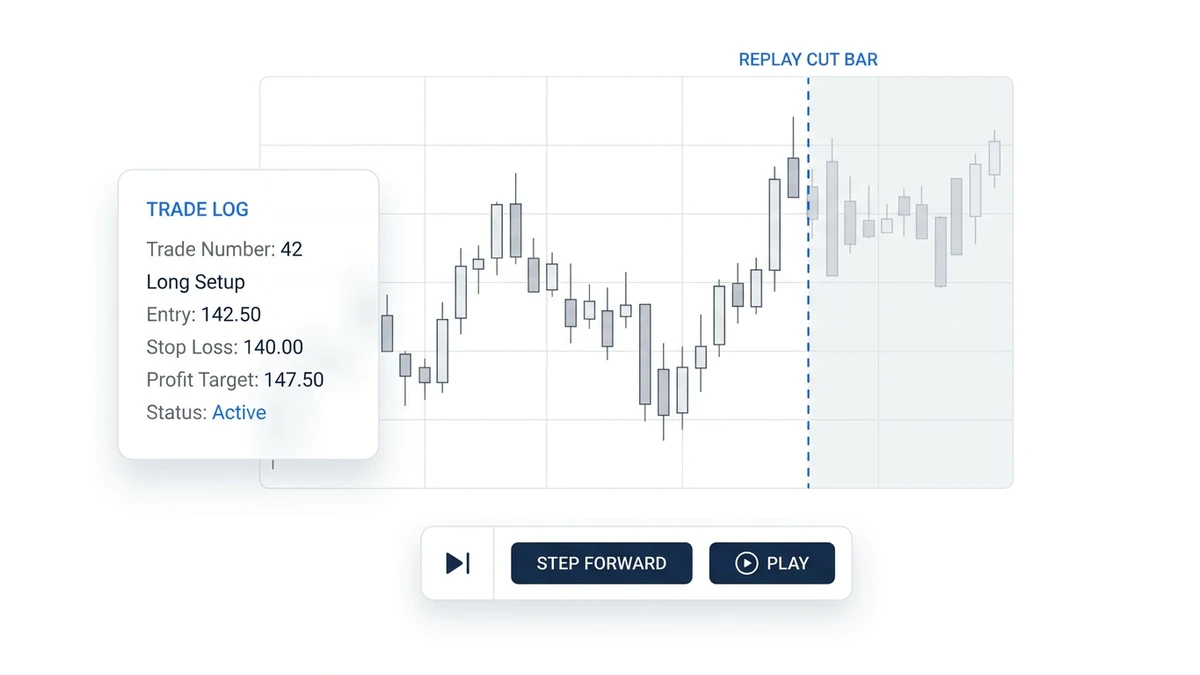
This is the part that stops most traders before they start — they assume backtesting means Pine Script or a Python notebook. It doesn't have to. Bar-replay tools hide every candle after a date you choose, then let you step forward one bar at a time, taking trades exactly as your written rules say, the way you would live.
No code, no indicators to script, no syntax to debug. You need eyes, your written rules from Step 1, and the discipline not to peek ahead at what the next candle does before you've already decided to enter.
What works well
- No coding skill required — works for discretionary and rule-based setups alike
- Forces you to actually see the setup form, bar by bar, instead of trusting a summary stat
What could be better
- Slower than a coded backtest for a large sample size
- Easy to unconsciously cherry-pick clean-looking trades if you're not disciplined about logging every signal
If your rules are fully mechanical — a moving-average crossover, a fixed breakout level — a coded strategy tester can run the same rules through hundreds of trades in minutes. Here's how that works on TradingView if you want the coded route instead. Most traders end up doing some of both: bar replay first to learn the setup, a coded tester once the rules are fully mechanical and a bigger sample size actually matters.
If you are evaluating different tools for this workflow, our guide to the best no-code backtesting software compares dedicated bar-replay platforms, charting tools, and journal simulators side by side.
Step 4: Log Every Signal, Not Just the Good Ones
This is where a lot of otherwise careful backtests quietly go wrong. It's tempting to skip a signal that looked messy, or to not bother logging a loss because "that one wasn't a fair test." Every skipped signal is a small, invisible edit to your own rules, made after the fact.
Log the entry, exit, result, and a one-line reason for every single signal your rules generate — including the ones you'd rather not have taken. If your backtest log only has winners, congratulations, you invented fiction. The losing trades are where the real information lives.
Step 5: Read the Metrics Together
Win rate, average risk-to-reward, profit factor, max drawdown, and the longest losing streak — read all five together, or don't bother reading any of them. Win rate alone means nothing: a 70% win rate with a 1:5 average loss-to-win ratio still loses money, and a 40% win rate can be very profitable with the right reward ratio.
Drawdown and losing streaks matter as much as the average outcome. A strategy that nets +20% a year but has an eight-trade losing streak in the middle needs a trader who can actually sit through that streak without abandoning the rules — which is a psychological question the backtest itself can't answer.
What each metric is actually telling you:
- Win rate. The share of trades that hit target instead of the stop. Meaningless on its own — pair it with risk-to-reward before drawing any conclusion.
- Risk-to-reward. How much you make on a winner versus how much you lose on a loser. A 1:2 ratio means winners are worth twice what losers cost.
- Profit factor. Gross profit divided by gross loss. Above 1 means the strategy made more than it lost overall — but a profit factor of 1.1 with a brutal drawdown is a very different strategy from a profit factor of 1.1 with a smooth equity curve.
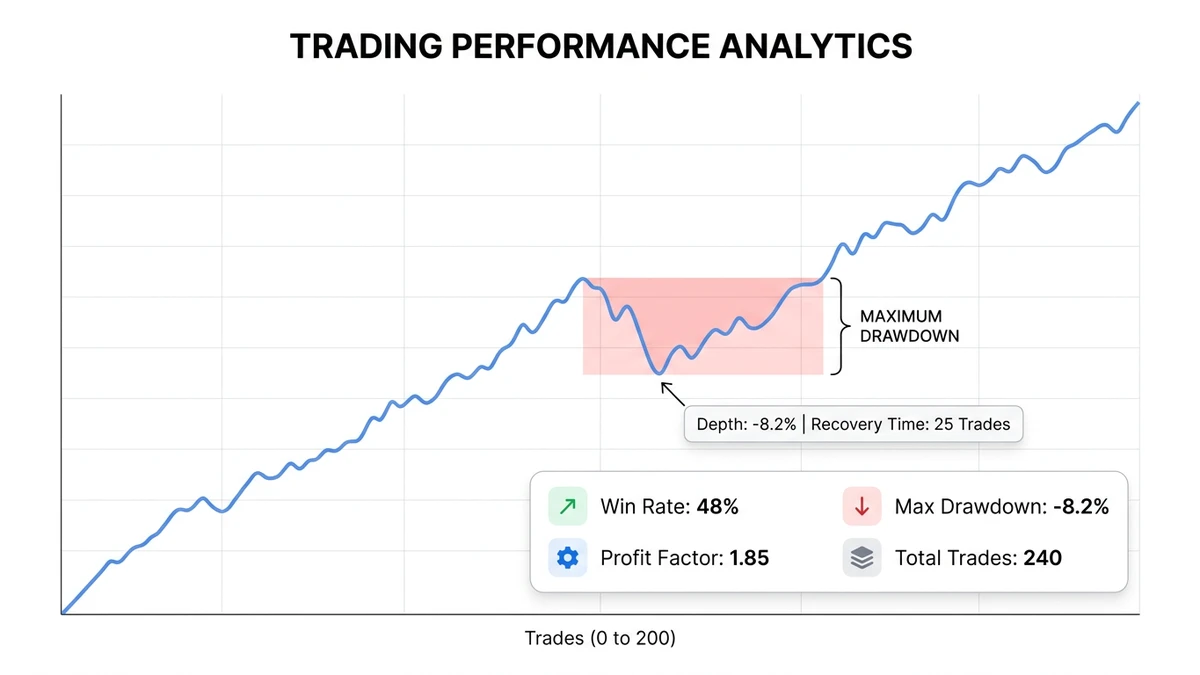
- Max drawdown. The largest peak-to-trough drop in the equity curve. This is the number that tells you what it would have actually felt like to hold the strategy through its worst stretch.
- Longest losing streak. How many trades in a row lost, back to back. A strategy with a 14-trade losing streak buried in the data needs a trader who won't quit on trade twelve.
A Worked Example: 240 Trades, One Verdict
Numbers make this less abstract. Say the rules are:
- Buy when the 20 EMA crosses above the 50 EMA on the daily chart.
- Stop loss at the most recent swing low.
- Target at 2x the risk (a 1:2 risk-to-reward).
- Exit early if price closes back below the 20 EMA before hitting either level.
Run that against five years of one instrument and, say, it generates 240 signals. 96 hit target, 120 hit the stop, and 24 got closed early on the EMA rule. That's a 40% win rate — sounds mediocre on its own.
But at 1:2 risk-to-reward, 40% wins is profitable: 96 wins × 2R minus 144 losses × 1R still nets +48R across 240 trades. The profit factor, the drawdown across the worst 12-month stretch, and how the strategy did in the flat, choppy years versus the trending ones all matter more than the headline win rate. That's the whole point of running the numbers instead of trusting the "feels like it works" version.
Notice what the example doesn't include: any claim that this exact rule set is profitable for you, on your market, right now. It isn't a recommendation. It's a demonstration of the arithmetic — go run your own rules on your own market and see what comes back.
Also notice what changes if the numbers shift slightly. Drop the win rate to 35% at the same 1:2 risk-to-reward and the strategy still nets a small profit — 84 wins × 2R minus 156 losses × 1R comes to +12R. Drop it to 30% and it flips negative. That's the actual value of running the arithmetic instead of eyeballing a chart: you find the exact point where a "decent-looking" setup stops paying for itself, before it costs you anything to find out live.
How Many Trades Before You Trust It?
Ten good trades prove very little. That's not a discouraging line, it's just the math — with a small sample, you genuinely can't tell a real edge from a lucky streak.
Backtesting with too few trades is basically astrology with extra steps. It feels rigorous because there's a spreadsheet involved. There usually isn't enough data in it to mean anything yet. Test enough signals across enough different market conditions that the strategy had to actually earn its result, not just get lucky during one calm stretch.
There's no universal minimum that applies to every strategy — a setup that triggers once a week needs years of data to build a meaningful sample, while one that triggers daily can reach a few hundred trades in a single year. What matters isn't hitting a specific number, it's making sure the sample spans enough different weeks, months, and market regimes that a lucky stretch couldn't fake the whole result on its own.
Mistakes That Quietly Ruin a Backtest
- Changing the rules mid-test. If a rule shifts because a trade didn't work out, you're not backtesting a strategy anymore. You're backtesting hindsight, and hindsight always wins.
- Ignoring costs and slippage. A strategy that barely wins after fees usually loses once real spreads and slippage show up. Model costs in from the first run, not as an afterthought once the equity curve already looks good.
- Testing on too small or too clean a sample. One trending quarter is not a market cycle. Neither is one instrument — a strategy that only works on one specific pair or stock might be exploiting something that has nothing to do with the rules.
- Overfitting the rules to the data. Keep adding filters until the equity curve looks perfect, and you've usually built a strategy that only works on the exact data you tested it on. A rule set that needed six specific conditions, each added after looking at the results, has learned the past by heart instead of finding a real edge. Researchers have quantified exactly how badly this inflates results the more parameters get tuned to fit the past.
- Look-ahead bias. Using information that wouldn't have been available at the time — like knowing today's close while judging today's open — quietly inflates results. It's rarely intentional. It's just easy to do by accident when you can already see what happens next on the chart. CFA Institute's own research covers this and other common backtesting pitfalls in more depth.
- Skipping the losing trades in the review. Covered in Step 4, and worth repeating: the losers carry more useful information than the winners do.
- Treating a passed backtest as permission to go all-in. A good backtest is not the finish line. Start small live, and let real execution prove it too, before position size catches up to conviction.
What to Do After a Strategy Passes
A backtest that passes is a start, not a verdict. Forward test it next — run the same fixed rules on new data the strategy has never seen, live or in a demo account, before any real size goes behind it.
| Method | Data used | What it catches |
|---|---|---|
| Backtesting | Historical data, all at once | Whether the rules have any statistical edge at all |
| Paper trading | Live prices, no real money | Whether you can actually follow the rules in real time |
| Forward testing | New data, after the backtest was built | Whether the edge survives outside the data it was tuned on |
Following a strategy from a course or a video was never enough for me on its own. I needed to know its normal drawdown, which conditions it went quiet in, and which of its "textbook" setups weren't actually worth taking. Backtesting gave me that. It didn't make the strategy permanent — nothing does — but it showed me exactly when the rules had evidence behind them and when they didn't. For more on what backtesting can and can't prove, here's the full explanation of what backtesting means, and if you're testing more than one strategy at once, portfolio backtesting covers how that changes the math.
Backtest Without Coding, Using Traders Journal
Backtesting is boring until it saves you from donating real money to a strategy that only worked in your head. It's still boring, though — which is exactly why a dedicated no-code tool helps more than a blank spreadsheet and a Pine Script tab.
We built Traders Journal so the five steps above happen in one place instead of five tabs:
- Write your rules, the same fixed entry, exit, stop, and size as Step 1 — no different just because it's now inside a tool.
- Pick your instrument and timeframe from roughly 30 markets — Indian indices, index futures, metals, forex, and crypto — with 5 to 29 years of historical data depending on the market.
- Replay bar by bar, no code required, and take the trade the moment your rule fires.
- Log the reason with every trade, not just the outcome — built into the same screen you're replaying on, so Step 4 stops being the step everyone skips.
- Let the analytics dashboard do the counting — win rate, risk-to-reward, drawdown, and profit factor, calculated automatically from what you actually logged, tagged by strategy if you run more than one.
Roughly 4,000+ traders currently use Traders Journal for this loop, across over 35,000 workspaces created so far. There's a free-forever plan to start, and premium is about $12 a month (₹500) if you want the full analytics set. None of it promises profit — nothing honestly can. What it does is turn "I think this strategy works" into something you can actually check.
👉 Start backtesting for free at TradersJournal.app. Pick one strategy, write the rules down, and let the data argue with your gut feeling. It usually wins.
For keeping the record once you go live, see what a trading journal actually is, or browse the rest of the Traders Journal blog for more on backtesting, journaling, and reviewing your results honestly.