
An MT4 backtesting report is the detailed statistical summary generated by MetaTrader 4's Strategy Tester after running an automated Expert Advisor (EA) over historical data. It delivers essential performance data across the Report tab, Results log, and Graph equity curve.
Most traders read these reports backwards. They look at the headline total net profit, get excited by a green number, and overlook critical indicators like modeling quality, sample size, and maximal drawdown.
What's Actually in an MT4 Backtesting Report
When you run an EA backtest in MetaTrader 4 (Ctrl+R), the platform compiles an extensive performance sheet accessible via the Report tab.
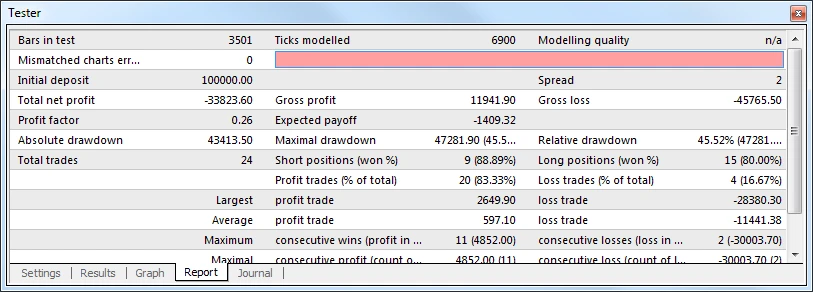
As detailed in MetaTrader 4's official documentation, this report compiles gross profit and loss, expected payoff, profit factor, absolute/maximal/relative drawdown, and win/loss streaks into one unified sheet.
The Metrics That Actually Matter
Five primary metrics determine whether your backtest represents a genuine statistical edge or curve-fitted luck:
| Key Metric | Target Benchmark | Strategic Significance |
|---|---|---|
| Profit Factor | > 1.5 to 2.0 | Gross profit divided by gross loss. Below 1.0 loses money; above 1.5 indicates a robust cushion. |
| Maximal Drawdown | < 15% to 20% | Worst peak-to-valley loss. Shows whether you could withstand losing stretches without capitulating. |
| Expected Payoff | Positive ($/trade) | Average expected return per trade after accounting for transaction costs and slippage. |
| Win Rate vs R:R | Dependent on payoff | A 70% win rate can fail with poor risk-reward; a 40% win rate succeeds with 1:3 reward-to-risk. |
| Consecutive Losses | < 6 to 8 trades | The longest losing streak tested. Demonstrates psychological resilience needed in live execution. |
Reading the Graph Tab and Equity Curve
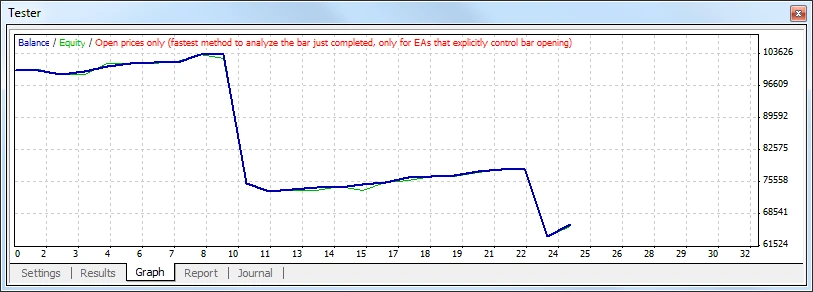
The Graph tab visualizes the progression of your equity over time. Look for smooth, consistent 45-degree upward slopes rather than flat horizontal lines interrupted by erratic vertical spikes.
If an EA shows flat performance for 11 months followed by a single massive gain, you are looking at a fragile strategy reliant on one market anomaly, not an enduring edge.
Modeling Quality Changes Everything (90% vs 99%)
Modeling quality measures how accurately MT4 simulated tick data within each historical candle:
- "Every tick" (90% to 99.9%): Reconstructs price fluctuations using fractional ticks. Essential for scalping and intraday systems.
- "1 minute OHLC" (N/A / Low Quality): Approximates intrabar movement using only Open, High, Low, and Close prices. Often creates illusory profits that collapse in live execution.
If your MT4 backtest report shows red bars or "n/a" under modeling quality, rerun the simulation using verified tick data before risking actual capital.
How Many Trades Before You Trust It
Statistical significance requires a substantial sample. A backtest with 25 trades is merely random noise. Aim for at least 100 to 300 trades spanning trending, ranging, high-volatility, and low-volatility market regimes.
Common Reading Mistakes & Pitfalls
- Fixating on Total Profit: High returns often mask catastrophic tail-risk and 50%+ drawdowns.
- Ignoring Spread and Slippage: MT4 uses fixed spreads by default unless explicitly configured. Live floating spreads and slippage degrade returns.
- Overfitting Parameters: Tuning input variables until the historical curve looks flawless guarantees failure in out-of-sample forward trading.
Where MT4's Tester Can't Help You
Here is the fundamental limitation the report never explicitly spells out: MT4's Strategy Tester only evaluates Expert Advisors (coded algorithms). If your strategy relies on discretionary market context, order flow nuances, or human chart reading, the Strategy Tester simply has nothing to run.
Forcing a discretionary price action setup into crude MQL4 logic produces an EA that barely reflects how you trade in reality. Furthermore, MetaTrader 5's mobile app has no strategy tester at all. Mobile traders are forced to scroll back through historical candles manually, proving that manual replay is an essential testing skill.
MT4 Strategy Tester vs No-Code Replay
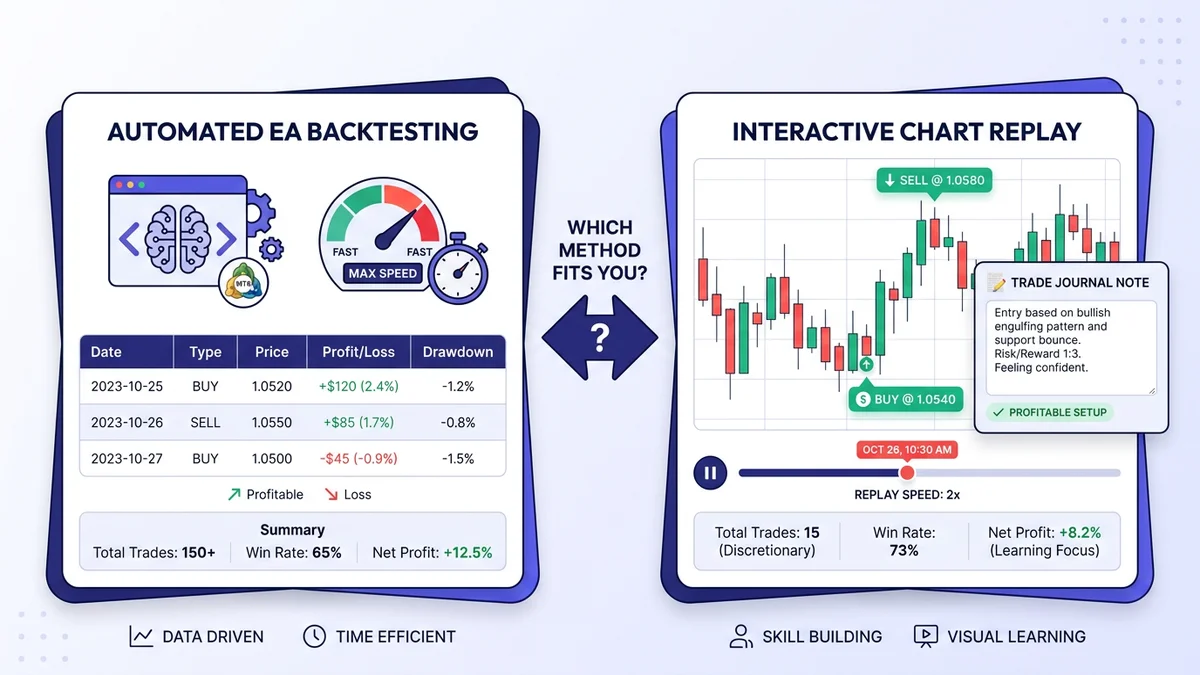
Neither method is universally superior — they serve entirely different styles of trading. Here is how they compare side by side:
| Criteria | MT4 Strategy Tester | No-Code Replay (Traders Journal) |
|---|---|---|
| Coding Required | Yes (MQL4 code required) | None (Point-and-click bar replay) |
| Execution Speed | Milliseconds across years of data | Candle-by-candle simulation pace |
| Discretionary Rules | Cannot test subjective judgment | Ideal for visual context & intuition |
| Journal Integration | Raw text log / HTML export only | Auto-logged trades & deep analytics |
| Platform Access | Windows desktop only | Web browser on any device (Mac, PC, Mobile) |
Which Approach Fits Your Trading
If you trade 100% mechanical systems coded into MQL4, MT4's Strategy Tester is the right tool. Pay strict attention to the profit factor, maximum drawdown, and modeling quality.
If your strategy requires chart pattern interpretation or multi-timeframe confirmation, an interactive no-code simulator is far more truthful. It simulates the real psychological pressure and decision-making you experience during live market hours.
How Traders Journal Helps
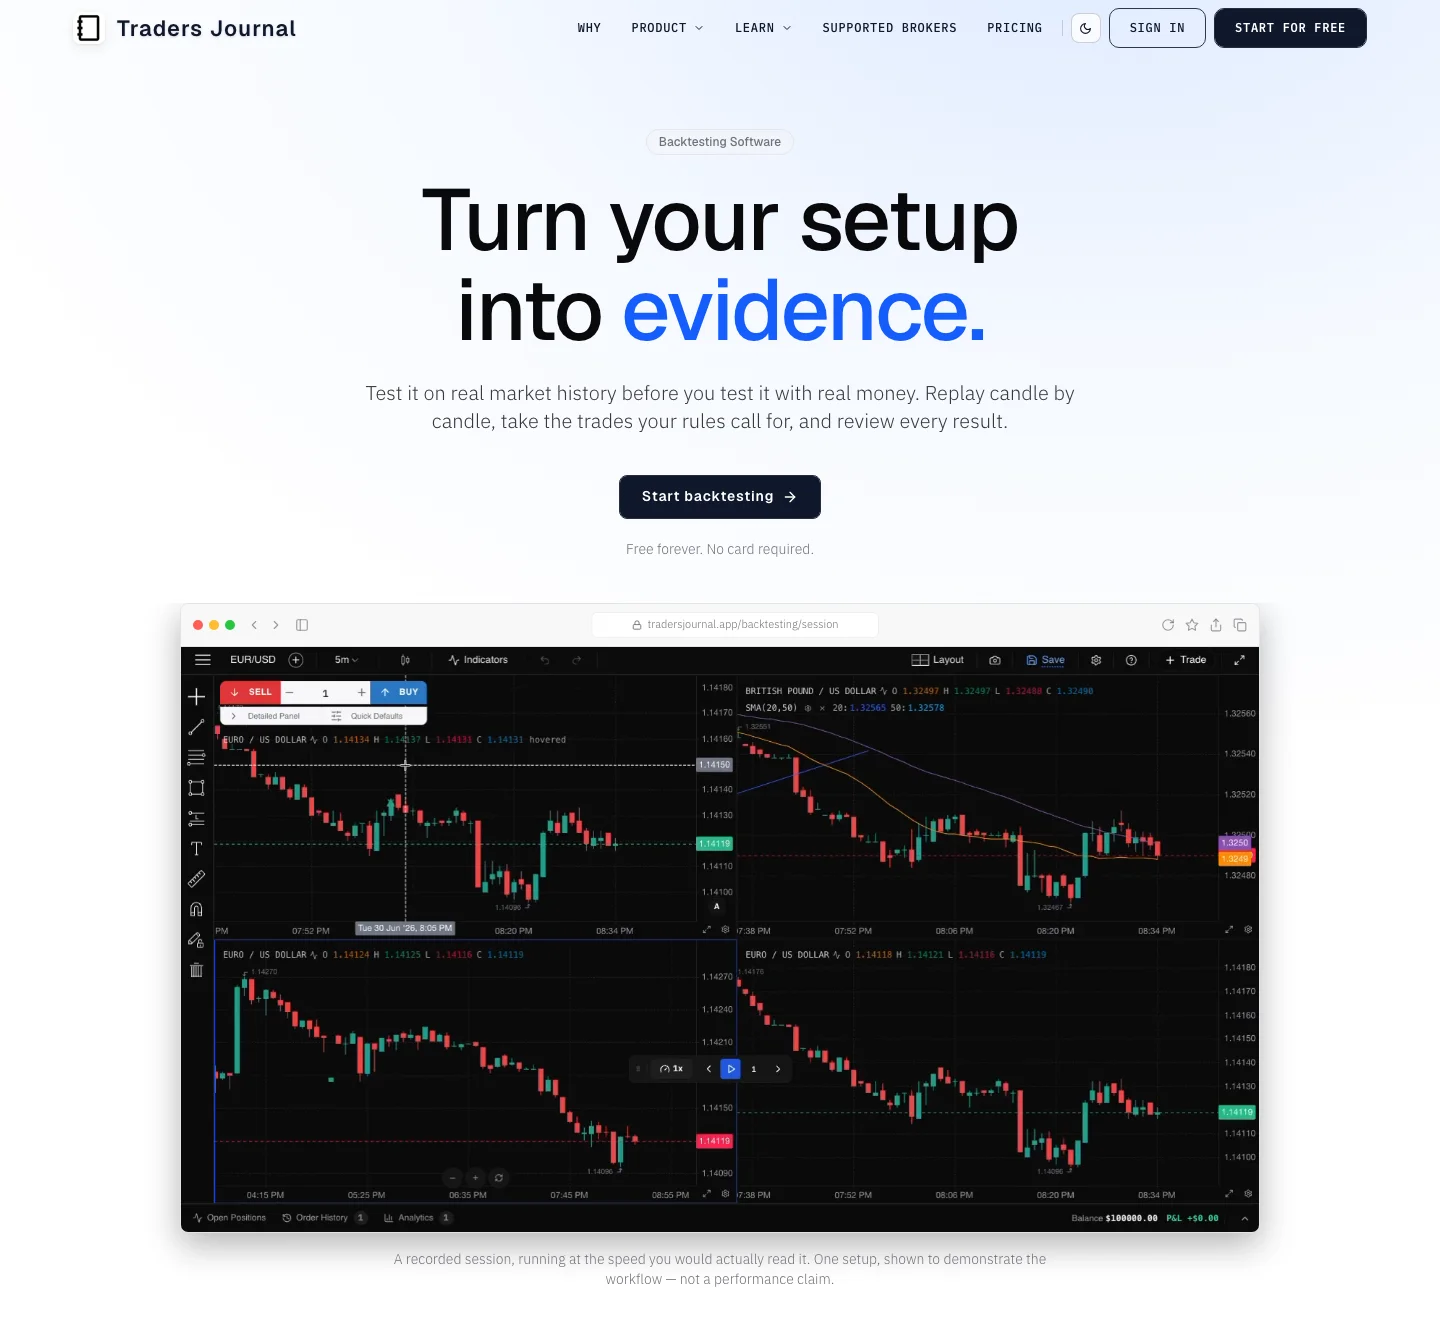
If your rules aren't coded into an EA, you don't need an MT4 report — you need a realistic way to replay price action and record every simulated execution. We built Traders Journal to provide TradingView-quality bar replay across 30+ instruments with up to 15 years of historical market data.
Every trade you take in replay automatically populates your trading journal with entry price, stop loss, take profit, and equity curve statistics. Over 3,600+ traders use it today on a free forever plan or premium for $12/month (₹499/mo).
👉 Start backtesting for free at TradersJournal.app.
Explore our comprehensive guide on what backtesting actually is, or review the best no-code backtesting software for additional comparisons.