An options trading journal is a record of every options position you open and close, logged with the fields that actually describe an option — strike, expiry, premium, contracts, call or put — instead of the flat entry/exit price a stock journal uses.
Most traders start theirs by copying a stock trading journal template and swapping "shares" for "contracts." It holds up fine until the first iron condor — four legs, one shared expiry, and a premium that moves the opposite way a stock price would — and the template has nothing to say about any of it.
This is what an options trading journal actually needs: the fields, what each one means, the mistake almost everyone makes copying a stock template, and how logging changes — or doesn't — depending on whether you're selling premium naked, selling it hedged, or buying it outright for a direction.
What Is an Options Trading Journal
It's a record of every options position you open and close — not the strategy itself, just the record of it — built around the things that actually describe an option: which strike, which expiry, how much premium changed hands, and how many contracts. A stock journal answers "did I buy low and sell high." An options journal has to answer that plus "was I paid enough for the risk I took on," because premium, not share price, is what actually moved.
The value isn't in having the record. It's in being able to look back after fifty trades and see which strikes, which expiries, and which market conditions you actually did well in — instead of a gut feeling that "options are hard" or "I'm decent at this."
The Fields It Needs, and What Each One Means
Nine columns come from any standard trading journal template — date, symbol, entry/exit, size, result, rule-followed, emotion, lesson. Options add a short, specific list on top:
| Field | What it actually means |
|---|---|
| Option type (call/put) | A call is the right to buy at the strike; a put is the right to sell, per the Options Industry Council's basics definitions. Selling either instead of buying flips who's obligated — get this wrong and every other number is meaningless. |
| Strike price | The price level the option is written against — how far it sits from the current price is what determines both your odds and your payout. |
| Expiry date | The clock the position is running against. Every day that passes without a favorable move is a day the option loses value on its own. |
| Premium (entry/exit) | The actual money that moved — what you paid or received for the contract. Not the underlying's price, which is a separate number entirely. |
| Contracts & multiplier | How many units you hold, and the point value each one represents (usually 100) — this is what turns premium into real P&L. |
| DTE at entry | Days to expiration when you opened — a fast way to see, months later, whether you consistently entered too close to expiry. A DTE of 0 is its own case: 0DTE trades carry gamma risk that can swing the position far more per point of underlying movement than a multi-week trade at the same strike distance, so it's worth being able to filter for those specifically. |
Six fields, each answering a specific question about the trade. None of them are decoration — skip the strike and you can't tell how far out-of-the-money you actually were; skip the DTE and you can't tell if a pattern of late entries is costing you.
Options Greeks Explained
The Greeks are why two trades with the same strike and the same expiry can behave completely differently. You don't need to log all five as columns — the FAQ below covers why — but you do need to know what each one is actually telling you before you can write an honest one-line reason for a trade:
| Greek | What it tells you |
|---|---|
| Delta | How much the option's price moves for a $1 move in the underlying, and a rough proxy for the odds it expires in-the-money — a 0.30 delta is roughly a 30% chance. |
| Theta | How much value the option loses per day, all else equal — negative for buyers, positive for sellers. This is the clock the entire naked-vs-hedged, buying-vs-selling split in this guide runs on. |
| Gamma | How fast delta itself changes as price moves. High gamma near expiry is why short-dated options can flip from "safe" to "in trouble" within a single session. |
| Vega | How much the option's price moves for a 1-point change in implied volatility — why two identical strikes can be priced completely differently a week apart. |
| IV (Implied Volatility) | The market's forecast of how much the underlying will move, baked into the premium. High IV means expensive options — good for sellers, expensive for buyers. |
In practice: sellers want high IV and positive theta working for them; buyers are fighting theta and want IV to expand after they're in, not before. Delta and gamma matter most for how much the position moves day to day. None of this needs its own column in the journal — it needs one sentence in the notes explaining which of these you were actually betting on.
The Mistake: Copying a Stock Journal Template
The single most common error is treating an option like a stock with a different name. Three specific ways that goes wrong:
- Logging price instead of premium. The underlying can move in your favor while the option you hold loses value, because decay outran the move. Track the wrong number and a losing trade reads as a win.
- Treating time as irrelevant. A stock position sitting flat is neutral. An options position sitting flat is quietly losing to theta the entire time. If DTE isn't logged, that erosion is invisible until the account statement shows it.
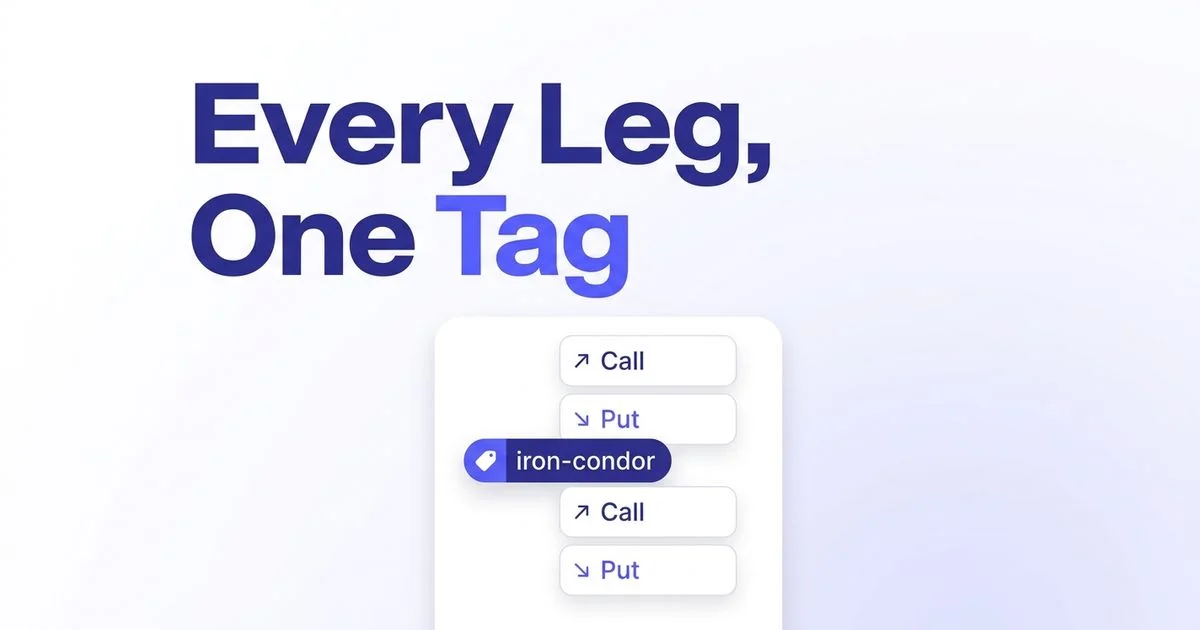
- Forcing one row per strategy. An iron condor is four legs, not one. Cramming four strikes and four premiums sideways into a single spreadsheet row works for exactly one trade before the format collapses under its own width.
None of these are exotic mistakes — they're the same three things, on repeat, in almost every abandoned options journal.
Logging It Right — One Position or Four, Same Process
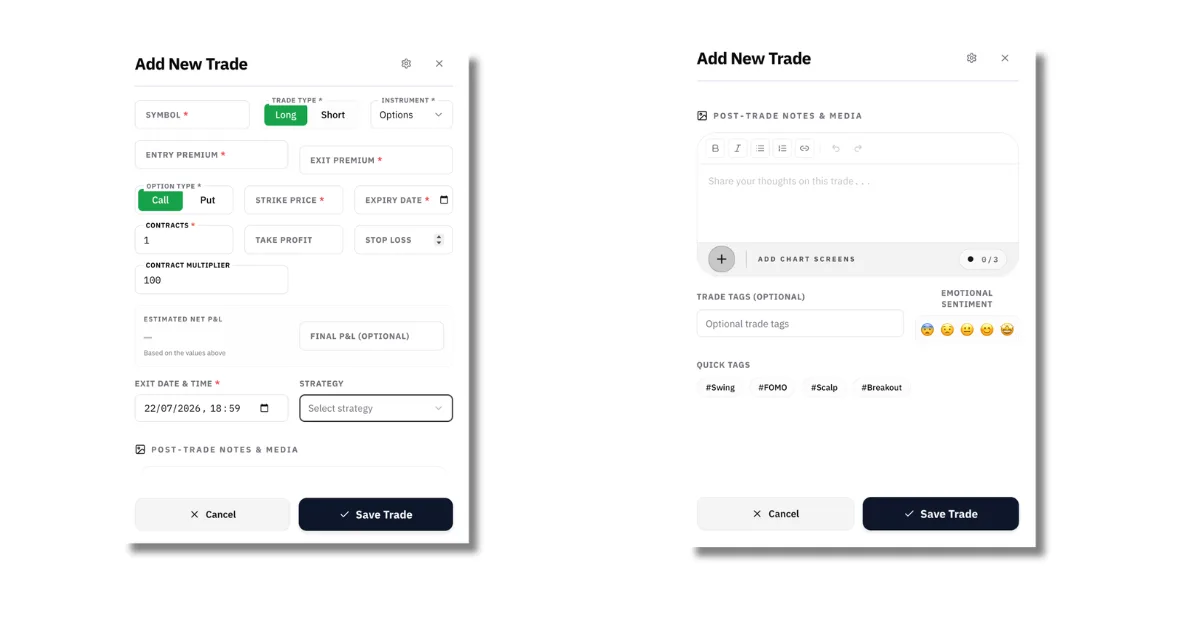
Whether it's a single call or one leg of a four-leg spread, the process doesn't change: pick Options as the instrument, fill in the real fields, and save. Here's the form with Options selected — Call/Put, Strike Price, and Expiry Date appear in place of the stock fields:
Here's one position filled in for real — a short SPY call, strike 748, expiry 28/07/2026, entry premium 2.65 — with a tag typed in before saving:
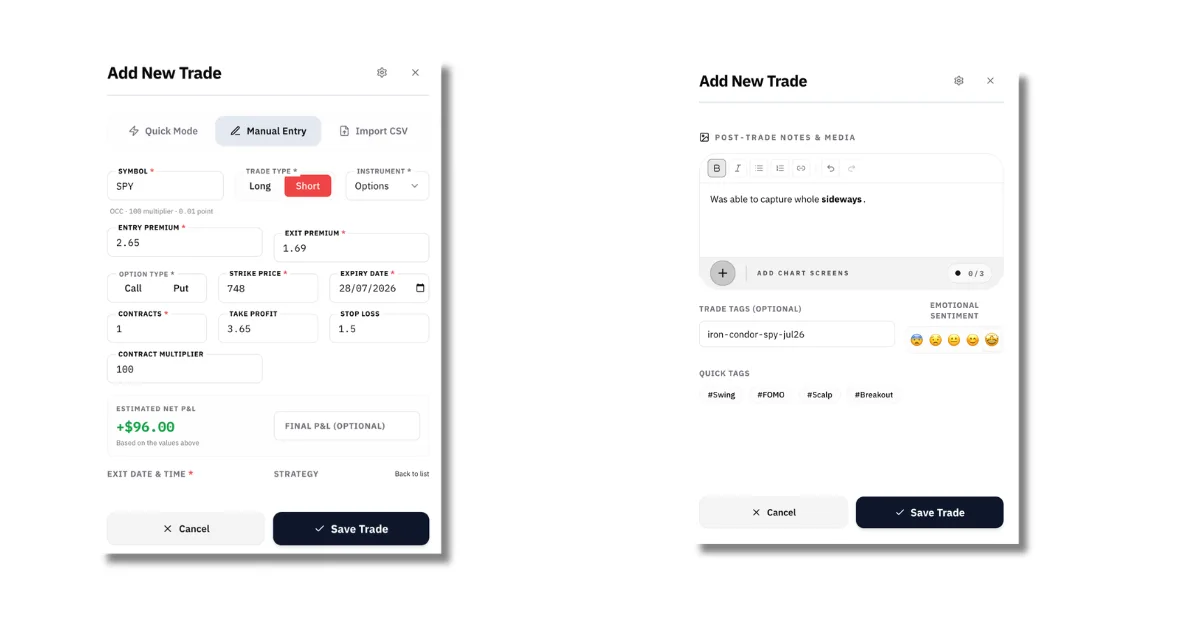
iron-condor-spy-jul26) attached on the right before saving.If this were a single directional call, that's the entire process — done. If it's one leg of a spread, the other legs get logged exactly the same way, each with its own real fields. What changes isn't the logging process; it's what ties related positions together afterward, which is what the next section covers.
Selling Premium: Naked vs. Hedged Is Its Own Question
Naked vs. hedged is a risk-structure decision, and it's separate from what you think the market will do. Both choices exist whether your view is pure range-bound or clearly directional:
- Pure sideways view, naked. Sell a call and a put with no protection — a short strangle. More premium collected, because you're carrying the full risk if price breaks out of range in either direction.
- Pure sideways view, hedged. The same short call and short put, plus a long call and long put further out to cap the loss — an iron condor. Less premium, in exchange for defined, known risk.
- Directional view (say, sideways-to-up), naked. Sell a put outright, betting price holds above the strike. Undefined risk to the downside, but this is a directional bet, not a range bet.
- Same directional view, hedged. Sell that put, then buy a further-out-of-the-money put against it — a bull put credit spread. Same bullish thesis, now with capped risk and less premium collected.
Same market view can be naked or hedged; same risk structure can back a sideways view or a directional one. The two questions — what do you think the market will do, and how much risk are you willing to leave undefined — are independent, and a journal that only tracks one of them misses half the picture. A shared Strategy label ("Iron Condor," "Bull Put Spread," "Short Strangle") plus a specific Tag for the instance is what keeps them from blurring together in your log:
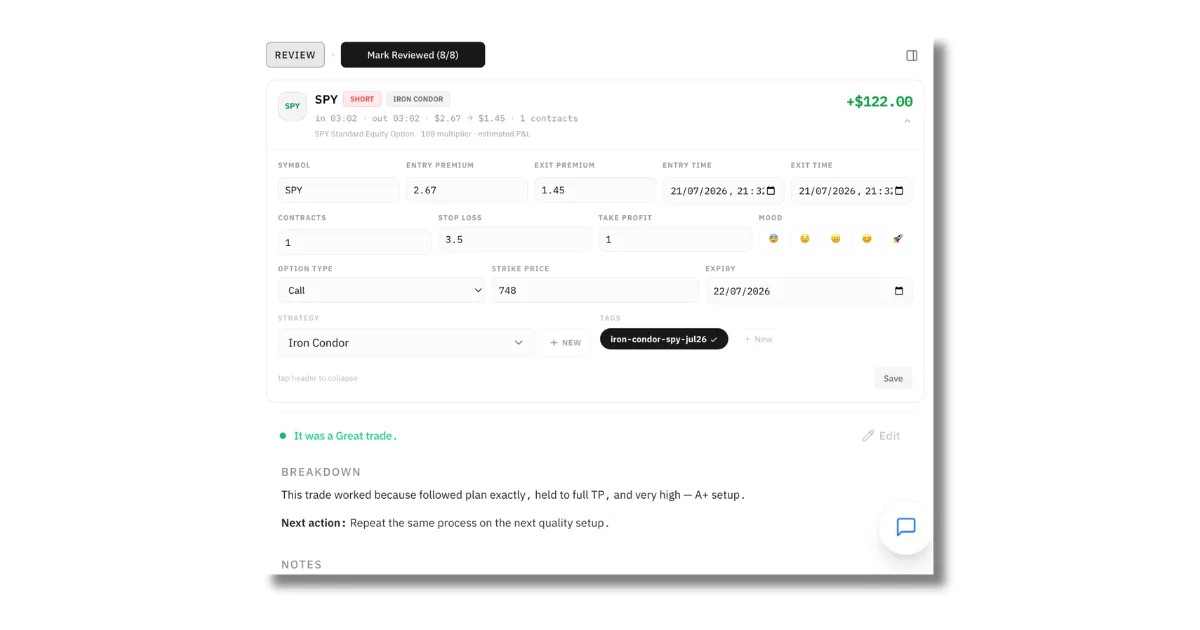
iron-condor-spy-jul26 — both sit next to strike, expiry, and premium on the same card.For any premium-selling trade — naked or hedged, sideways or directional — the numbers worth logging beyond the basics: IV at entry (higher IV means more premium, but also a wider expected range), how far out-of-the-money each strike sat, and whether a loss came from the view being wrong or just from a slightly tight strike. A naked short put and a hedged bull put spread on the same underlying, same week, can post very different results purely because of how much risk was left undefined.
A quick worked example makes that trade-off concrete. Say XYZ is at $102 and the view is bullish above $100:
- Naked short put, 100 strike, $2.10 premium. Collect $210. If XYZ holds above $100 through expiry, that's the entire profit — but the full $10,000 the strike represents is at risk if price gaps well below $100.
- Bull put spread, short 100 / long 95, $1.30 net premium. Collect $130 — $80 less than the naked put — but max loss is capped at $500 minus the $130 collected ($370), no matter how far XYZ falls.
Logged side by side under the same Strategy structure, that $80 difference in premium against a $370 known worst case versus an undefined one is what tells you whether the extra premium was worth the extra risk — a comparison a single win-rate number can't make for you.
The Wheel Strategy: Assignment and Cost Basis
The wheel is the one premium-selling strategy where the journal has to survive contact with an actual stock position, not just an option that expires worthless or gets closed for a debit. The mechanics: sell a cash-secured put; if it expires worthless, keep the premium and sell another; if it's assigned, the result is 100 shares per contract at the strike price — and from there, covered calls get sold against those shares until one is called away, at which point the cycle restarts.
Two things break a normal options log the moment assignment happens:
- Cost basis isn't the strike price alone. The real cost basis is strike minus every put premium collected before assignment. Sell a $50 put for $1.20 in premium and get assigned, and the shares cost $48.80, not $50 — miss that adjustment and every covered call sold against those shares looks less profitable than it actually is.
- Assignment and exercise are separate events from a normal close. A put assigned or a call exercised isn't a loss in the usual sense — it's a conversion from an option position into a stock position, and it needs its own entry (or a clear tag) so the P&L on the option leg doesn't get double-counted against the stock leg that follows.
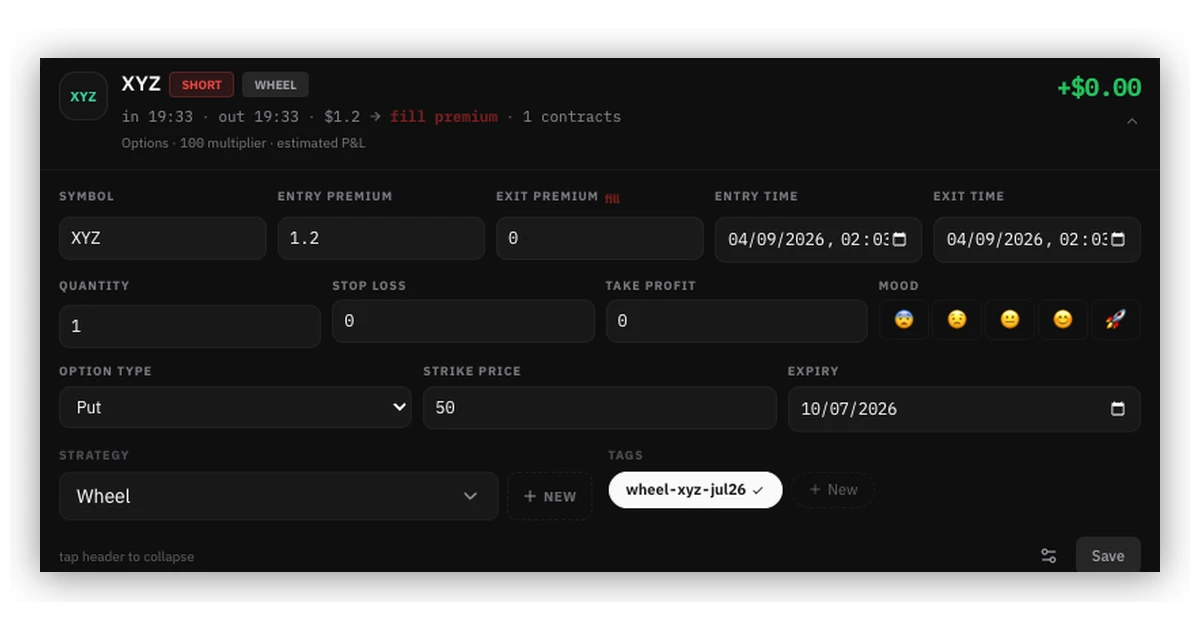
wheel-xyz-jul26 — the same tag carries over to the shares and every covered call sold against them once assigned.Log each turn of the wheel as its own position — the cash-secured put, then the shares (with the premium-adjusted cost basis), then each covered call sold against them — tied together with a shared Strategy label ("Wheel") and a Tag for that specific cycle. Reviewed as one thread instead of three unrelated rows, that's the only way to see whether a wheel is actually profitable once assignment risk is priced in, or just collecting premium on paper until the first sharp drop.
Buying Premium: The Pure Directional Bet
Buying a call or a put outright — for a move you expect to run cleanly, without much sideways chop first — is a different structure from anything above. As the buyer, risk is already defined the moment you pay the premium; there's no naked-vs-hedged decision to make, because the most you can lose is what you paid. That's what makes this a genuinely different game, not a third point on the same naked/hedged spectrum:
- Being right on direction isn't enough. Theta decays the premium every day, so a correct directional call that takes too long to play out can still lose money on the option itself.
- IV works against you differently. Buying into elevated IV means paying a premium that has to fall enough just to break even, on top of being right about direction.
- Win rate isn't the number that matters. A directional strategy can be profitable at a 35% win rate if the winners are large enough — reviewing it by win rate alone, the way you'd judge a premium-selling trade, gives a misleading read.
Worked example: XYZ at $100, buy a 30-day $105 call for $2.00 ($200) expecting a breakout. Ten days in, XYZ is at $103 — right on direction — but with 20 days of theta decay and no move past $105 yet, the call is worth $1.35 ($135), a $65 loss on a correct call. It isn't until XYZ actually clears $105 with enough time left that the position turns profitable. Logging "right on direction, wrong on timing" at close is what separates that from "wrong thesis" the next time a string of directional trades gets reviewed.
Log the same fields as any option — strike, expiry, premium, contracts — but the notes should carry the actual reasoning: what signal triggered the entry, and whether the eventual result was decided by direction, by timing, or by decay outrunning a correct call. That distinction is invisible in the numbers alone.
Reviewing by Structure, Not Just Total P&L
A single blended win rate across everything hides more than it reveals — a 45% win rate might be excellent for a directional call and a warning sign for a short strangle. Two splits matter more than one overall number: premium sold vs. premium bought (probability game vs. direction game), and within premium sold, naked vs. hedged (how much risk was actually left undefined). Here's the dashboard after logging a few trades:
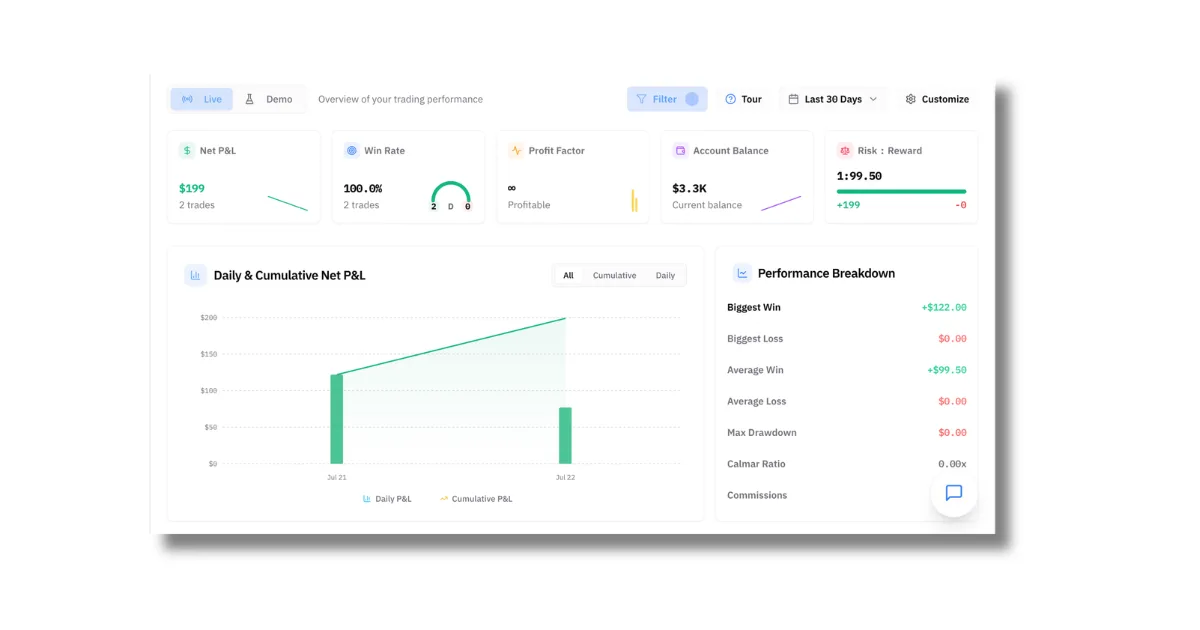
Reviewed weekly, split by structure rather than as one pile, three things become visible fast:
- Whether premium-selling trades are winning on probability or a lucky quiet stretch. A strangle or a credit spread that's never seen a real breakout hasn't actually been tested yet.
- Whether naked trades are getting away with undefined risk, or actually earning it. A naked short put that's never been tested against a sharp drop looks identical to a hedged one — until it isn't.
- Whether directional trades are right on direction but still losing. If the direction call was correct more often than not but the P&L doesn't show it, decay or entry timing is the actual leak.
Common Options Journaling Mistakes
- Tracking price instead of premium. The two move in opposite directions often enough that mixing them up quietly wrecks the P&L math.
- Blending naked, hedged, and directional trades into one win rate. They're different games with different risk left on the table — reviewed together, none of their real performance is visible.
- No shared Strategy or Tag on multi-leg trades. Four untagged rows from the same condor read as four unrelated trades a month later.
- Logging every Greek, rereading none of them. Numbers copied from a broker screen because a template had the columns, not because they answer a question you actually ask yourself.
- Mixing paper and real option trades in one log. Paper fills carry no slippage or assignment risk, so blending the two flatters your real win rate.
Getting Started
Everything shown above is the actual product, not a mockup — Traders Journal is free to start, and 3,600+ traders currently use it to log and review naked, hedged, and directional options strategies alike, in one place. If you're still comparing journal apps, see how it stacks up in the best free trading journal software roundup. Sizing up a single call or put before you log it? Run the numbers first in the options profit calculator.
Free options trading journal template — no email required
Get the free template →Start your free options trading journal at TradersJournal.app.