Every trader has a strategy that "works." Ask them for the ten backtested trades that prove it and the room goes quiet.
That gap — between "I think this works" and "here's the evidence" — is exactly what backtesting closes. It won't tell you a strategy will make money. It will tell you whether your confidence in it is earned or just vibes wearing a trading plan.
What Is Backtesting? (Short Answer)
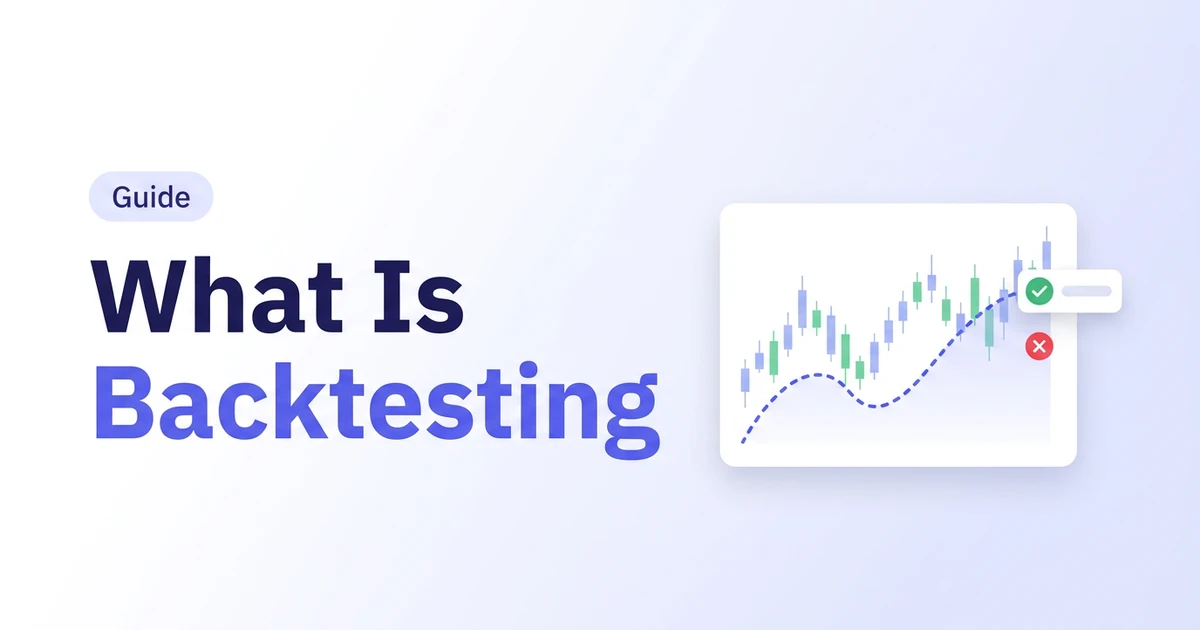
Backtesting is running a trading strategy's exact entry, exit, and risk rules against historical price data to see how it would have performed — without risking a single rupee or dollar of real money.
In simple words: you write down the rules first, then let old charts grade them. Not the other way around.
The word gets used loosely. "Backtested" should mean the strategy was run against a fixed, pre-written rule set over historical data — not "I looked at some old charts and this setup seemed to work a lot."
Why Backtesting Matters
Look — most losing strategies don't fail because the trader was careless. They fail because nobody checked if the idea had evidence behind it before real money went in.
Backtesting is required before risking serious money. It can't predict the future — no test on old data can — but it can expose weak rules and false confidence while the cost of being wrong is just your time, not your account.
This isn't a niche habit either. CFA Institute's own research found that half of investment professionals surveyed had run a backtest on a strategy in the past 12 months.
Following a strategy from a course or a YouTube video was never enough for me. I needed to know its normal drawdown, which market conditions it struggled in, and which of its "textbook" setups were actually worth taking. Backtesting is what gave me that. It didn't make the strategy permanent — nothing does — but it showed me exactly when the rules had evidence behind them and when they didn't.
That's the real value: not proof of future profit, but proof you're not just guessing with extra steps.
There's also a quieter benefit most traders don't expect going in: backtesting teaches you your own strategy better than reading about it ever will. Scroll through two hundred historical trades and you start noticing the setup fails a specific way in choppy conditions, or that the stop is consistently too tight during high-volatility weeks. That kind of detail doesn't show up in a course. It shows up in the data, after you've actually gone looking for it.
How Backtesting Works
Four steps. None of them are complicated, but skipping any one of them quietly ruins the result.
1. Write the Rules Down, Exactly
Entry condition, exit condition, stop loss, position size — all of it, in writing, before you look at a single chart. "Buy near support" is not a rule. "Buy when price closes above the 20 EMA on the 15-minute chart after touching the prior day's low" is a rule.
Backtesting must follow fixed rules. Random entries on old charts are still random entries, just wearing a spreadsheet.
2. Choose Your Data and Time Period
Use at least five years of data where you can. A strategy needs to face trending, ranging, volatile, and quiet markets before you trust it — three good months of a strong uptrend will flatter almost any trend-following idea.
Pick a market and timeframe that actually matches how you plan to trade: don't backtest 5-minute scalps on daily candles and expect the result to mean anything.
3. Run the Backtest
Manually, by scrolling through historical bars and logging each signal, or with software that replays the data and applies your rules for you. Manual backtesting teaches you to actually see the setup. Software backtesting gets you through hundreds of trades in the time manual testing gets you through twenty.
What works well
- Slower, but you learn to recognise the setup by eye
- No cost, works with any charting platform
What could be better
- Painfully slow for a large sample size
- Easy to unconsciously cherry-pick trades that look clean
Most traders end up doing some of both — manual first to learn the setup, software once they trust the rules and want a real sample size. For the full five-step walkthrough with no code required, here's how to backtest a trading strategy step by step. If you want the platform-specific steps instead, here's how to backtest on TradingView, or if you're running an EA through MT4, here's how to read the backtesting report it generates. And if you're testing more than one strategy at once, portfolio backtesting covers how that changes the math.
4. Read the Results Honestly
Win rate, average risk-to-reward, profit factor, max drawdown, and the longest losing streak. Win rate alone means nothing — a 70% win rate with a 1:5 average loss-to-win ratio still loses money. Read all of it together, or don't bother reading any of it.
A Simple Backtesting Example
Numbers make this less abstract. Say the rules are:
- Buy when the 20 EMA crosses above the 50 EMA on the daily chart.
- Stop loss at the most recent swing low.
- Target at 2x the risk (a 1:2 risk-to-reward).
- Exit early if price closes back below the 20 EMA before hitting either level.
Run that against five years of one instrument and, say, it generates 240 signals. 96 hit target, 120 hit the stop, and 24 got closed early on the EMA rule. That's a 40% win rate — sounds mediocre on its own.
But at 1:2 risk-to-reward, 40% wins is profitable: 96 wins × 2R minus 144 losses × 1R still nets +48R across 240 trades. The profit factor, drawdown across the worst 12-month stretch, and how the strategy did in the flat, choppy years versus the trending ones all matter more than the headline win rate. That's the whole point of running the numbers instead of trusting the "feels like it works" version.
Notice what the example doesn't include: any claim that this exact rule set is profitable for you, on your market, right now. It isn't a recommendation. It's a demonstration of the arithmetic — go run your own rules on your own market and see what comes back.
Backtesting vs Paper Trading vs Forward Testing
These three get used interchangeably. They're not the same check, and each one catches something the others miss.
| Method | Data used | What it catches |
|---|---|---|
| Backtesting | Historical data, all at once | Whether the rules have any statistical edge at all |
| Paper trading | Live prices, no real money | Whether you can actually follow the rules in real time |
| Forward testing | New data, after the backtest was built | Whether the edge survives outside the data it was tuned on |
A strategy that passes a backtest but falls apart in paper trading usually has an execution problem, not a rules problem — the trader is hesitating, over-riding, or moving stops. A strategy that passes both but fades in forward testing usually means the backtest found a pattern in noise, not a real edge.
Run all three in order and each one is a cheaper filter than the next. A weak backtest costs you an afternoon. A weak paper-trading stretch costs you a few weeks of attention. Skipping straight to live trading because the backtest looked good costs you the thing you were trying to protect in the first place.
What Backtesting Can't Tell You
Backtesting relies on the idea that a strategy which performed well on past data will likely perform well going forward. That assumption has real limits, and pretending it doesn't is how good backtests turn into bad live accounts.
- It can't predict the future. Past performance is evidence, not a guarantee. Markets change as participants, technology, and conditions change — a rule set built on 2019 volatility doesn't automatically survive whatever regime shows up next.
- It's easy to overfit without noticing. Keep adding filters until the equity curve looks perfect, and you've usually built a strategy that only works on the data you tested it on. Every extra condition that was added after looking at the results is one more way the strategy has learned the past by heart instead of finding a real edge. Researchers have quantified exactly how badly this inflates results — the more parameters you tune to fit the past, the less the numbers mean going forward.
- Look-ahead bias sneaks in. Using information that wouldn't have been available at the time — like knowing today's close while "backtesting" today's open — quietly inflates results. It's rarely intentional. It's just easy to do by accident with the wrong data feed or a sloppy script.
- Costs get skipped. Spreads, slippage, and fees rarely get modeled accurately, and they eat into results that looked great on paper. A strategy that clears 0.3R per trade before costs can go negative once realistic slippage is priced in.
- It doesn't test you. A backtest has no fear, no greed, and no hesitation. Live execution adds all three, and that's usually where a good backtest quietly stops mattering.
None of this means don't backtest. It means treat a passed backtest as a starting point, not a verdict.
A backtest tells you whether the idea has evidence. It cannot tell you whether you will follow the rules when real money and real fear show up.
How Many Trades Do You Actually Need?
Ten good trades prove very little. That's not a discouraging line, it's just the math — with a small sample, you genuinely can't tell a real edge from a lucky streak.
Test enough trades to separate an edge from luck, across enough different market conditions that the strategy had to actually earn its result. A strategy that only gets tested during one calm uptrend hasn't been tested — it's been flattered.
Backtesting with too few trades is basically astrology with extra steps. It feels rigorous because there's a spreadsheet involved. There usually isn't enough data in it to mean anything yet.
Common Backtesting Mistakes
- Changing the rules mid-test. If a rule shifts because a trade didn't work out, you're not backtesting a strategy anymore. You're backtesting hindsight, and hindsight always wins.
- Ignoring costs and slippage. A strategy that barely wins after fees usually loses once real spreads and slippage show up. Model costs in from the first run, not as an afterthought once the equity curve already looks good.
- Testing on too small or too clean a sample. One trending quarter is not a market cycle. Neither is one instrument — a strategy that only works on one specific pair or stock might be exploiting something that has nothing to do with the rules.
- Skipping the losing trades in the review. If your backtest log only has winners, congratulations — you invented fiction. The losers are where the real information lives.
- Treating a passed backtest as permission to go all-in. A good backtest is not the finish line. Start small live, and let real execution prove it too, before position size catches up to conviction.
How to Start Backtesting
- Pick one strategy and write its rules down. Entry, exit, stop, position size. If you can't write it in a sentence, it's not ready to test.
- Choose a market, timeframe, and at least a few years of data. Match it to how you actually plan to trade.
- Run it — manually first if you're new to the setup. Log every signal the rules generate, not just the ones that look good.
- Read win rate, risk-to-reward, drawdown, and losing streaks together. Not one number in isolation.
- Forward test before risking real size. A backtest that holds up on new data is worth a lot more than one that only looked good in hindsight.
If you'd rather skip building a spreadsheet from scratch, this roundup of no-code backtesting software covers the tools that do the heavy lifting for you, and free futures backtesting is worth a look if futures are your market.
None of these five steps need to happen in one sitting. Write the rules today, pull the data tomorrow, run the test over a weekend. The strategy isn't going anywhere. What matters is that each step actually happens, in order, instead of skipping straight to "it felt right" because that's faster.
How Traders Journal Helps
Backtesting is boring until it saves you from donating real money to a strategy that only worked in your head. It's still boring, though — which is exactly why a dedicated tool helps more than a blank spreadsheet.
We built Traders Journal to keep charting, journaling, and backtesting in one place instead of switching between five tabs. Backtest a strategy with bar replay across roughly 30 instruments — Indian indices, index futures, metals, forex, and crypto — with up to 15 years of historical data now available. Log the trades it generates straight into your journal, then review the stats without rebuilding a spreadsheet from scratch. Roughly 3,600+ traders use it today, and together they've created over 35,000 workspaces.
There's a free forever plan to start, and premium is $12 / ₹499 a month if you want the full set. None of it promises profit — nothing honestly can. What it does is turn "I think this strategy works" into something you can actually check.
👉 Start backtesting for free at TradersJournal.app. Pick one strategy, write the rules down, and let the data argue with your gut feeling. It usually wins.
For more on keeping the record once you go live, see what a trading journal actually is, or browse the rest of the Traders Journal blog for more trading education.