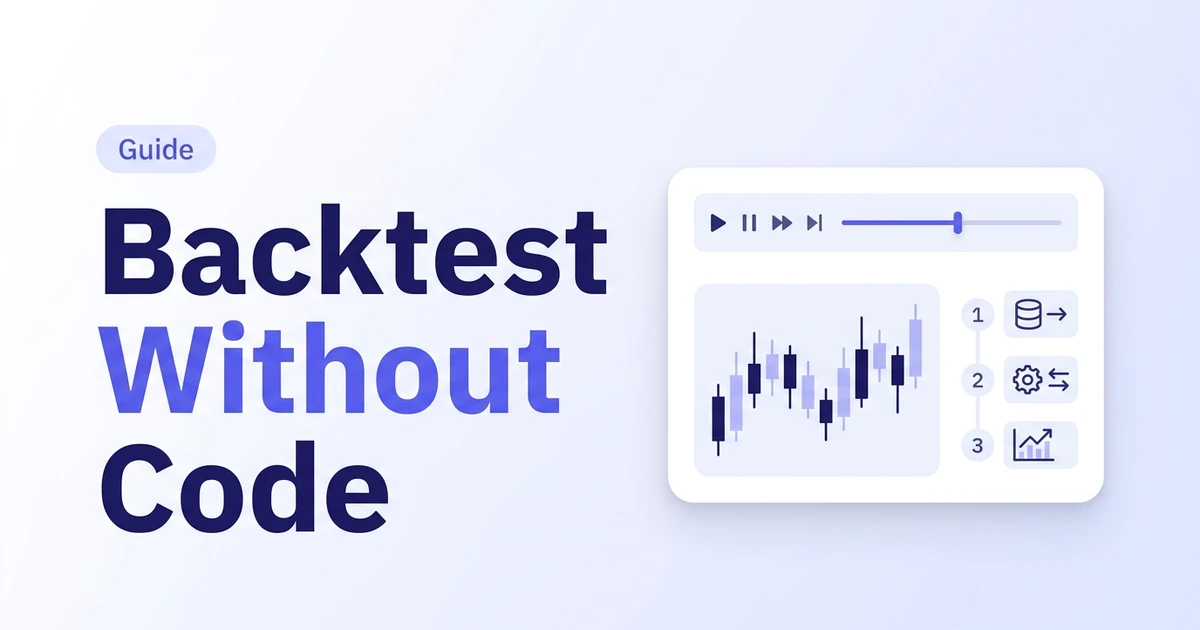
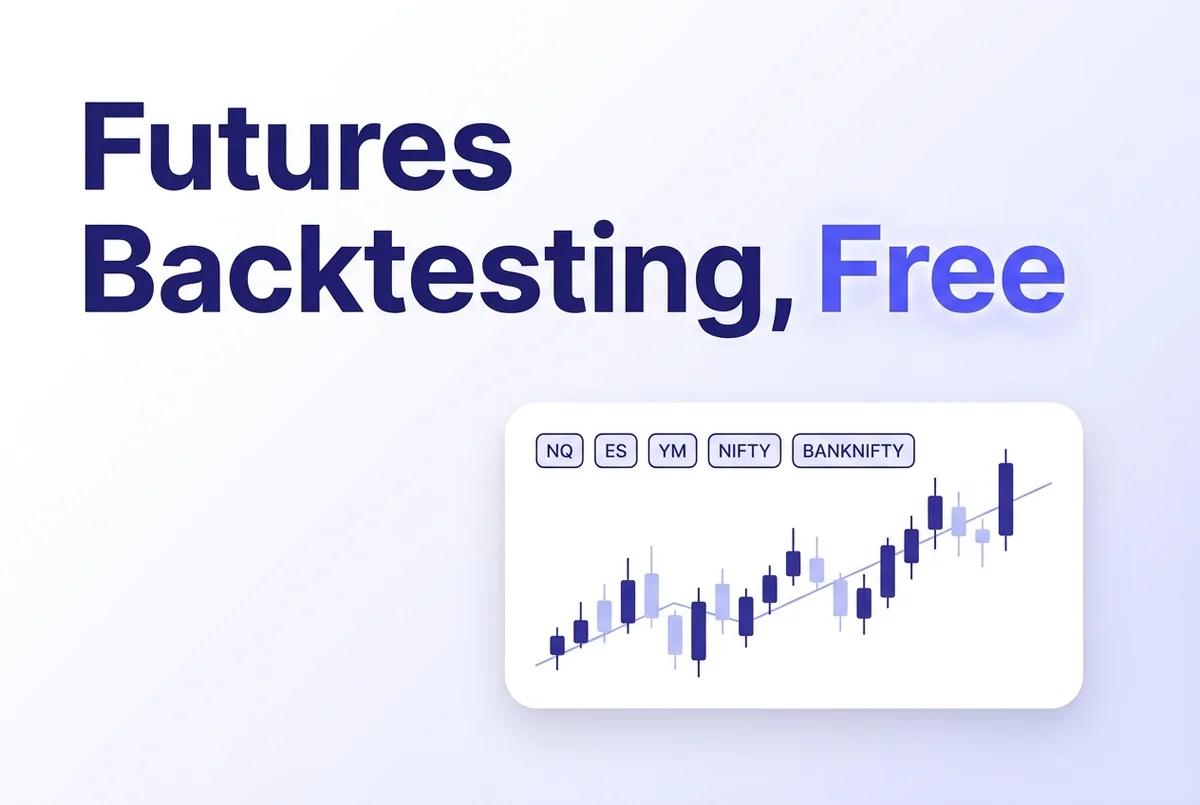
A futures backtest replays historical price data, applies a fixed set of entry and exit rules, and records what would have happened — before any real money is on the line. Do it properly and you get evidence. Do it on ten cherry-picked trades and you get a story you'll keep telling yourself, right up until the account gives you a reality check.
This guide covers futures backtesting the way it actually works: contract specs, session timing, expiry rollover, and a step-by-step workflow you can run today, free, without writing code. It covers both sides of the desk — NIFTY 50 and BANKNIFTY for Indian index traders, and NASDAQ, Dow Jones, and S&P 500 futures for everyone trading US markets. Most free futures backtesting software picks one side and ignores the other. Futures don't care which exchange you prefer, so neither does this article.
Search for "futures backtesting software" and most results are either a bare charting tool with no rules engine, or a paid platform that treats a free plan as an afterthought. Search for "backtest futures free" and you mostly get demo accounts with a 14-day clock attached. This guide, and the platform behind it, assumes you actually want to finish a real backtest — years of data, a real rules engine, and no expiring trial — not just look at a chart for a week.
What Futures Backtesting Actually Means
The most common mistake is the gambler mindset: take ten trades, win seven, declare the strategy proven. When it fails live, the excuse is ready-made — "history doesn't decide the future." True. Also not the point.
Backtesting is not a crystal ball. It's a way to see how a fixed rule set behaves across different market conditions — trending, sideways, and volatile — using data you can't argue with. You're not trying to predict the next candle. You're trying to find out whether an edge survives contact with reality, before reality gets your money instead of your strategy. If the mechanics are new to you, start with what backtesting means and how it actually works.
That's why bar-replay backtesting beats staring at a finished chart and convincing yourself you'd have taken the trade. You replay history bar by bar, place trades under the same fixed rules every time, and let the sample size do the talking. A trending run makes almost any breakout system look brilliant. A sideways stretch exposes it. A sharp, volatile drop tests whether your stop-loss rule actually holds up when it matters. Ten good trades from one of those conditions prove very little on their own. A few hundred trades across all three start to mean something.
Take S&P 500 futures as an example. Replay a strong 2023-style trending stretch and a simple pullback entry looks unbeatable. Replay a choppy, range-bound month and the same entry gets chopped up by false breakouts. Replay a sharp volatility spike and you find out whether your stop-loss size was ever realistic to begin with. None of those three replays tells the full story alone. Run all three, under the same fixed rules, and you get an honest answer instead of a flattering one.
Markets We Cover and Where the Data Comes From
Traders Journal supports free futures backtesting on two markets, not one. On the Indian side: NIFTY 50 and BANKNIFTY index futures. On the global side: NASDAQ (E-mini and Micro E-mini), Dow Jones (E-mini), and S&P 500 (E-mini and Micro E-mini) futures — the three most actively traded US index contracts. Whether you're searching for NIFTY futures backtesting or backtest futures free for NASDAQ, it's the same workflow inside one platform.
Data quality is the part most free tools quietly skip, and the two markets are sourced differently on purpose. NASDAQ, Dow Jones, and S&P 500 futures come from an institutional-grade market data vendor — the same class of exchange feed institutions use for these contracts. NIFTY 50 and BANKNIFTY come from direct broker feeds instead, since that's where NSE index futures data is sourced reliably. Neither side is guesswork, and neither is a scraped or delayed feed.
This isn't a fresh, untested dataset either — Traders Journal has run 6 years of futures history through over 34,000 backtesting workspaces for 3,500+ traders so far.
Both sides update on the same weekly cadence: every Saturday, the data from the week that just closed — Monday through Friday — gets added. So if a trading week runs the 10th to the 14th, the missing candles for that week land in the platform on Saturday the 15th, and the same thing happens again the following Saturday. That means the data you're backtesting against is never more than a few days behind the live market, and it's never "current as of some point last quarter" the way a lot of free tools quietly are. Depending on the instrument, 6 to 10 years of history is available, enough to cover multiple full market cycles rather than a single lucky quarter.
One more detail worth knowing before you replay a single candle: the historical data is 1-minute, 1-hour, and 1-day OHLCV bars — real time-based candles built from actual exchange trades, not a tick-by-tick feed and not "tick charts" (candles built from a fixed number of trades instead of a fixed amount of time). That distinction matters because the "tick value" you'll see in the next section is a different thing entirely — it's what one minimum price increment is worth in money, for position sizing, regardless of which candle timeframe you're replaying on.
Contract Basics: Tick Value, Sessions & Rollover
Before you place a single replay trade, three numbers decide whether your backtest means anything: tick value, session timing, and rollover.
Tick value tells you what one minimum price move is worth in real money. For the three US index futures, it's fixed by the exchange and hasn't changed in years:
| Contract | Point value | Tick size | Tick value |
|---|---|---|---|
| E-mini S&P 500 (ES) | $50 × index | 0.25 | $12.50 |
| E-mini Nasdaq-100 (NQ) | $20 × index | 0.25 | $5.00 |
| E-mini Dow ($5) (YM) | $5 × index | 1 point | $5.00 |
Source: CME Group contract specifications.
NIFTY 50 and BANKNIFTY work the same way in principle — lot size determines the rupee value of one point — but NSE revises index futures lot sizes periodically to keep contract value inside its regulatory band. The lot size that was correct six months ago may not be correct today. Always check the current lot size before sizing a backtest; Traders Journal keeps this current inside the platform so you're not stuck tracking NSE circulars by hand.
Session timing is the second number people skip. NASDAQ, Dow, and S&P 500 futures trade nearly 23 hours a day, but liquidity and volatility are not spread evenly — the US cash session (Regular Trading Hours, or RTH) behaves differently from the overnight Extended Trading Hours (ETH) session. A breakout strategy tuned on ETH's thinner volume can look completely different when you run the same rules through RTH. NIFTY and BANKNIFTY trade within NSE's single daily session, so the comparison is simpler, but the same rule applies: backtest the session you'll actually be trading in, not whichever one had the cleanest-looking chart.
Rollover is the third. Futures contracts expire. As a contract nears expiry, volume shifts to the next month's contract, and a backtest that ignores this will show you a price gap that isn't real — or, worse, hide a widening spread that would have stopped you out if you were trading live. Roll to the next contract at the point real volume actually rolls over, not on the calendar expiry date itself.
For NASDAQ, Dow, and S&P 500 futures, this is handled for you before the data ever reaches the chart. ES, NQ, and YM expire quarterly — March, June, September, and December — and the historical series Traders Journal replays is a continuous front-month contract stitched by volume: whichever contract month actually has the most volume on a given day is the one in the chart, so the switch to the next contract happens when real trading activity moves there, not on a fixed date picked in advance. You still need to know a roll is happening — it's still a change of contract — but you're not guessing when.
NIFTY and BANKNIFTY expire monthly, so rollover shows up far more often across a multi-year backtest, which is exactly why it's easy to under-count how many times it actually happened. Over a five-year backtest, NIFTY alone crosses roughly sixty monthly expiries. Ignore even a handful of those and your win rate stops being a real number.
How to Backtest Futures, Step by Step
Here's the actual workflow inside Traders Journal — the same core loop of chart, replay, journal, and review, whether you're testing NIFTY or NASDAQ.
1. Pick your instrument and date range. Choose NIFTY 50, BANKNIFTY, NASDAQ, Dow Jones, or S&P 500, then set how far back you want to replay. Five to six years is a reasonable minimum — enough to cross at least one full cycle of trending, sideways, and volatile conditions.
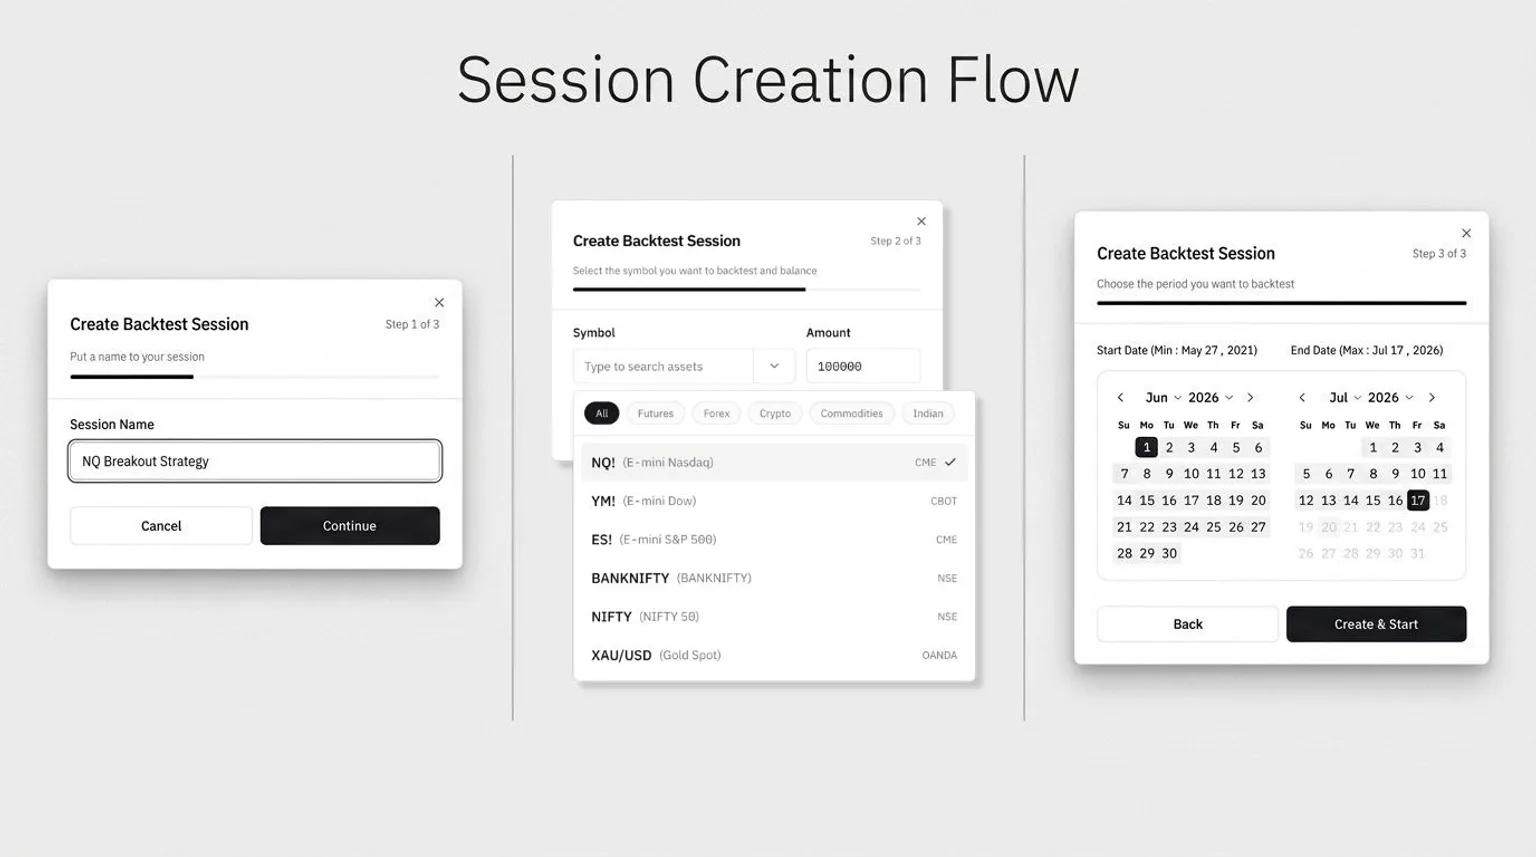
2. Set your fixed rules before you press play. Entry trigger, stop-loss, target, and position size — write them down first. If you're deciding trade by trade as the bars replay, you're not backtesting. You're just trading old candles with the benefit of hindsight.
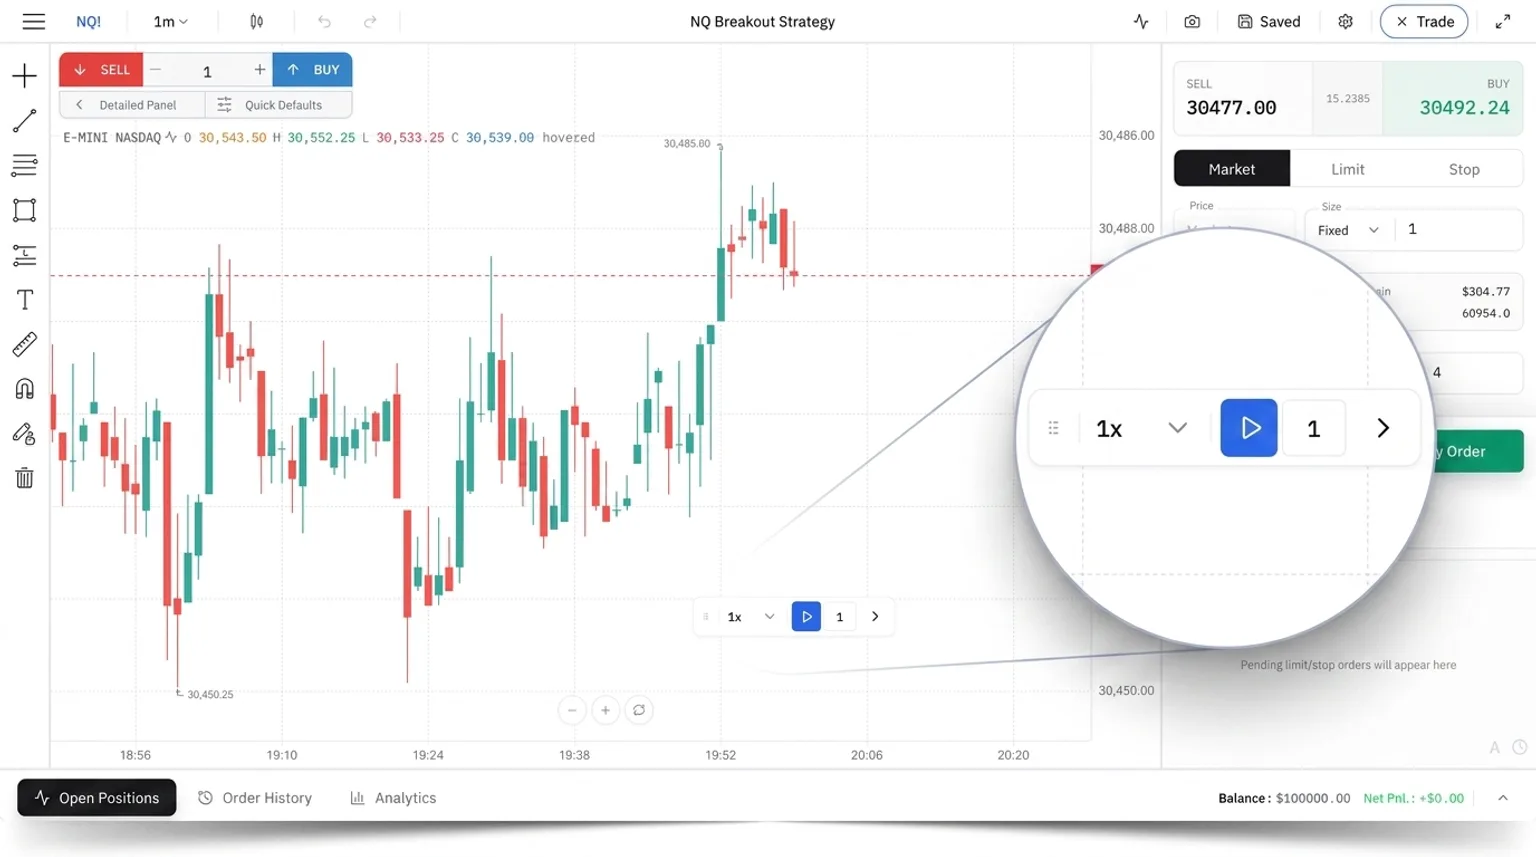
3. Replay bar by bar. Step forward one candle at a time. When your entry rule fires, take the trade exactly as written. No moving the stop because "it felt tight." A stop-loss is not a suggestion — the market does not negotiate because you had a strong feeling.
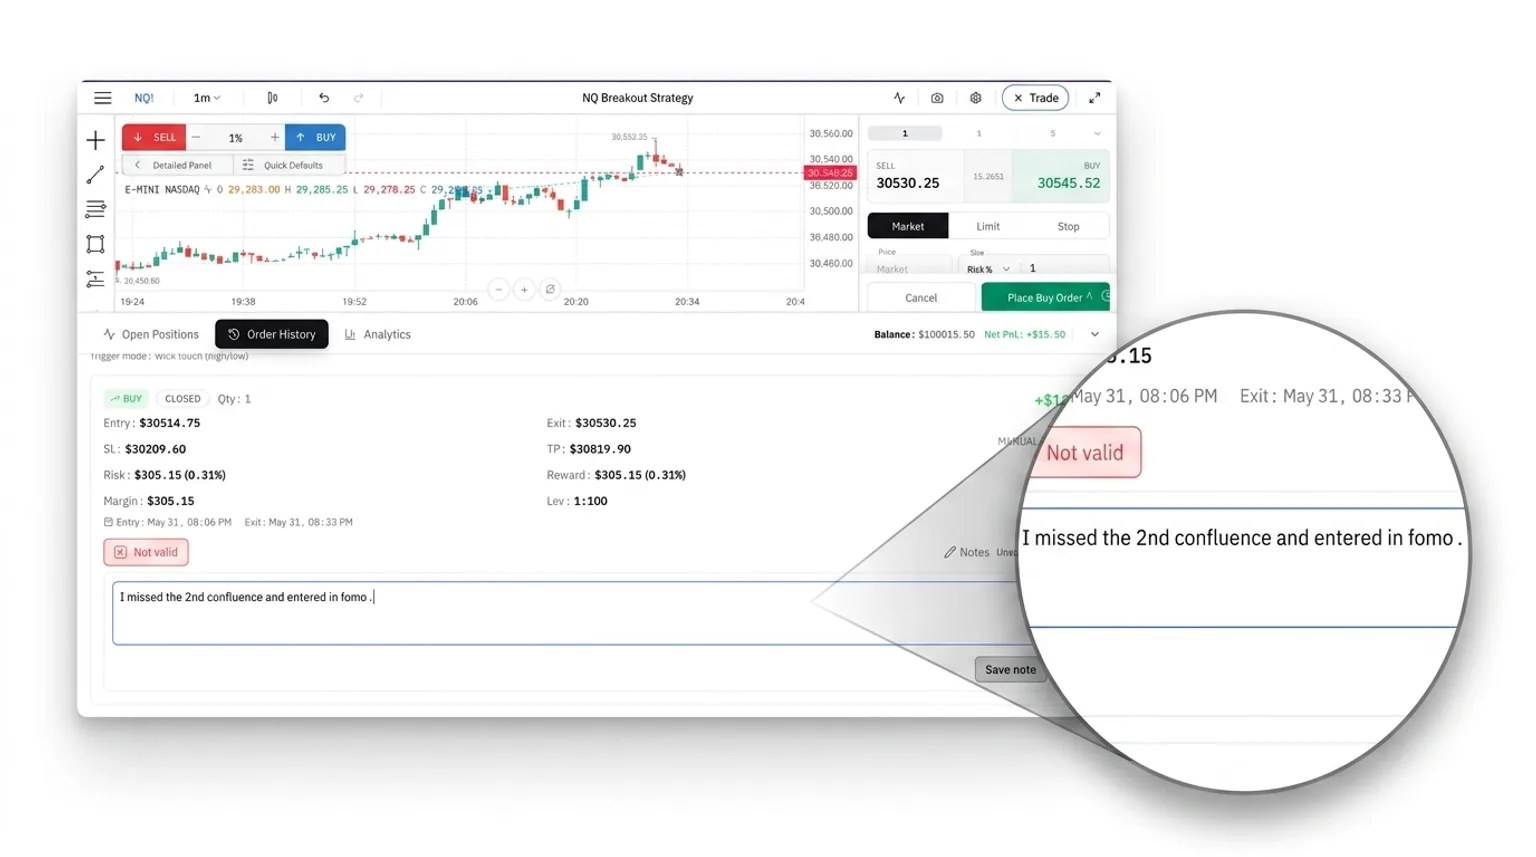
4. Log every trade as you go. Entry, exit, reason, and result — win or lose. A journal that only records winners isn't a journal, it's fan fiction. This is also where rollover matters: if the replay crosses an expiry, log which contract you were actually in at the time.
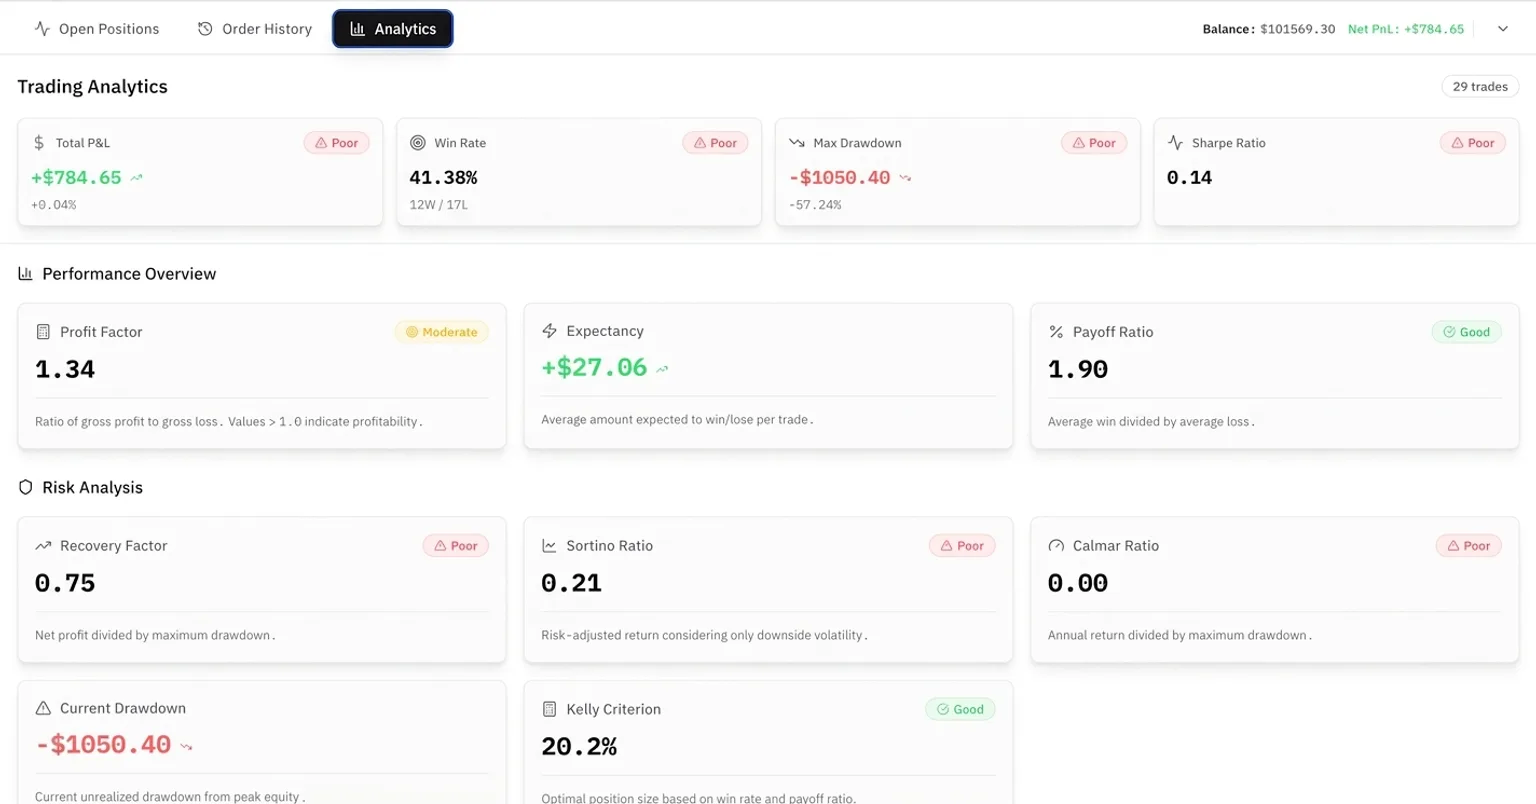
5. Let the analytics do the counting. Win rate, average risk-reward, drawdown, and profit factor, calculated automatically from your logged trades. Don't eyeball your equity curve and call it a day — the number you weren't looking for is usually the one that matters.
6. Repeat across market conditions. Run the same fixed rules through a trending stretch, a sideways stretch, and a volatile stretch. A strategy that only works in one regime isn't an edge — it's a coincidence with good timing.
That's the whole loop, and it's the same loop whether the instrument on screen says NIFTY 50 or S&P 500. The only things that change between markets are the ones covered above: the tick or lot value, the session you're replaying, and how often rollover shows up. Get those three right once, and switching instruments stops being a new learning curve every time.
Common Mistakes That Wreck a Backtest
Most backtests fail before the first real trade, for the same handful of reasons:
- Curve-fitting. Tweaking rules until they match the exact trades you already know worked. That's not a strategy — that's memorising the answer key. It looks perfect on the data you tested and falls apart the moment new data shows up, because it was never a rule, it was a description of the past.
- Too few trades. Ten trades tell you whether you got lucky or unlucky ten times, nothing more. A real sample, across a few hundred trades and multiple market conditions, is what separates an edge from a streak.
- Ignoring rollover. Treating an expiring contract's price gap as a real market move, which either inflates your win rate with a fake gain or blames a loss on "volatility" that was actually just the contract switch.
- Mixing sessions. Backtesting NASDAQ entries on ETH volatility, then trading them live during RTH, or the other way around. The rules held up against the wrong session, so the results were never testing what you'll actually trade.
- Skipping commissions and slippage. A strategy that's profitable before costs and unprofitable after costs was never really profitable — it was a spreadsheet that forgot fees exist.
Fix these five and most of what's left is discipline — the boring kind that happens to be free.
3 Rules I Don't Break When Backtesting
In six years of trading, process has mattered more than any single strategy. Three rules I don't skip:
- Start with a pre-defined system. Entry, stop-loss, and target, fixed before the first replay candle. Clicking randomly on old charts isn't backtesting — it's just playing the market with a time machine.
- Test a full market cycle. At least five to six years of data, covering trending, sideways, and sharp-drawdown periods. That's the only path to confidence that isn't just hope wearing a spreadsheet.
- Treat it like a real investment. The capital here is time and patience, not money. A few focused hours now save real losses later — that's the whole trade.
Following a strategy on paper was never enough for me either. What I actually needed to know was the normal drawdown, the conditions where the edge disappeared, and the trades not worth taking. Backtesting gave me that. It didn't make any strategy permanent — markets change, and the data always gets the final vote.
Your Edge Is Built, Not Found
Profitability isn't a personality trait you either have or don't. It's a loop: backtest to find out if the edge is real, journal to keep using it with discipline, and repeat when the market shifts underneath you.
Traders Journal runs that loop for NIFTY 50, BANKNIFTY, NASDAQ, Dow Jones, and S&P 500 futures, with bar-replay backtesting, trade journaling, and analytics in one free workspace — no code, no spreadsheet gymnastics. If you want a wider comparison first, see how it stacks up in our 5 Best No-Code Backtesting Software roundup, check the FXReplay comparison if forex is also on your radar, read how to backtest on TradingView if that's where you're testing your futures strategy first, or see how portfolio backtesting works if you're testing more than one instrument at once.
Data updates every Saturday with the week that just closed, so you're never testing against a stale month. Start backtesting for free at Traders Journal — no credit card required — or see what's included on each plan.