
On this page
VWAP is the session's average price, weighted by volume
A simple moving average treats every candle the same, like a vote where the trader who bought one share counts as much as the fund that bought a million. VWAP doesn't. A candle where 2,000 contracts traded pulls the line twice as hard as one where 1,000 traded, so VWAP sits closer to where the real business got done. That's why it shows up on almost every day trader's chart and on institutional execution desks, where filling a large order near VWAP is a common benchmark for a fair fill. The line accumulates from the session open and resets at the next one, so by the afternoon it's slow to move: it's averaging the whole day, not the last few bars. In Traders Journal's charts and backtesting workspace, VWAP uses the typical price (high + low + close, divided by three) as its source by default, resets every session, and draws a one-standard-deviation band around the line.
01Check which side of VWAP price is on
Above VWAP, the average buyer today is in profit and sellers are on the back foot. Below it, the opposite. This is the read most traders use: a bias filter for the session, not an entry on its own.
02Read the slope, not just the level
A rising VWAP means each new chunk of volume is trading at higher prices. A flat VWAP with price chopping through it in both directions usually means a balanced, range-bound session, where trend setups tend to struggle.
03Measure the distance from VWAP
The further price runs from VWAP, the more stretched the move. The standard-deviation bands put a number on that stretch, so you can tell a normal move from an extended one instead of eyeballing it.
04Watch the session reset
VWAP starts again at each session open. The first few bars of the day are noisy because the average is built on very little volume, and the line becomes steadier as the session goes on.
The VWAP formula
VWAP = Σ (Typical Price × Volume) ÷ Σ Volume, where Typical Price = (High + Low + Close) ÷ 3
Both sums run from the session open to the current bar. For each bar, take its typical price, multiply it by that bar's volume, and add it to a running total. Keep a second running total of volume. Divide the first by the second and you have VWAP for that bar. At the next session open, both totals go back to zero. Some platforms let you swap the source from typical price to the close or another price, but typical price is the usual default, including on TradingView and in Traders Journal. The 5-bar calculation further down this page walks through the numbers.
VWAP bands and anchored VWAP
01VWAP standard-deviation bands
Bands sit at a multiple of the volume-weighted standard deviation above and below VWAP, usually 1, 2 and 3. They answer one question: how far from the session's average is price right now, compared with how spread out trading has been today? A touch of the +2 band in a quiet session is a big stretch. The same distance on a news day may be routine. Traders Journal shows band 1 by default and lets you switch on bands 2 and 3, or change them to a percentage of VWAP instead.
02Anchored VWAP
Anchored VWAP starts the calculation from a point you choose instead of the session open: a swing low, a breakout bar, an earnings gap. It answers a different question: what's the average price paid by everyone who traded since that event? Swing traders use it because a regular session VWAP resets every day and forgets the move. In Traders Journal it's a drawing tool. Click a bar and the line starts accumulating from there.
03Weekly and monthly VWAP
Changing the anchor period from session to week, month, quarter or year turns VWAP into a longer benchmark that doesn't reset daily. A weekly VWAP is useful context on intraday charts when you want to know whether this week's buyers are in profit, not just today's.
Three ways traders actually use VWAP
First, as a bias filter: only take longs while price holds above a rising VWAP and only shorts below a falling one, which keeps you on the side the session's volume supports. Second, as a pullback entry: in a trending session, price often comes back to test VWAP before continuing, and traders wait for that test to show a rejection candle before entering, with the stop on the other side of the line. Third, as a mean-reversion target: when price stretches to an outer band in a flat, range-bound session, some traders fade the move back toward VWAP. That's a different trade with different rules, and it's covered in full on the VWAP mean reversion strategy page. All three are ideas, not edges. Somebody on the internet has a VWAP setup with an 80% win rate; don't copy the claim, test it. Which version works, on which market and session, is something you find out by replaying it, not by reading about it.
Worked examples
Five one-minute bars, worked through
Take the first five one-minute bars of a session. Bar 1 has a typical price of 100.10 on 1,000 volume, so VWAP is 100.10. Bar 2 trades higher at 100.30 on 800 volume: the running totals become 180,340 and 1,800, and VWAP rises to 100.19. Bar 3 adds 600 at 100.20, leaving VWAP at 100.19. Then volume picks up as price drops: 1,500 at 99.90 pulls VWAP down to 100.08, and 2,100 at 99.70 drags it to 99.95. A plain average of the five typical prices would be 100.04. VWAP sits lower because most of the volume traded at the lower prices. With the last close at 99.70, below VWAP, sellers controlled the busiest part of the opening. The full table is below.
Pullback to VWAP in an uptrend
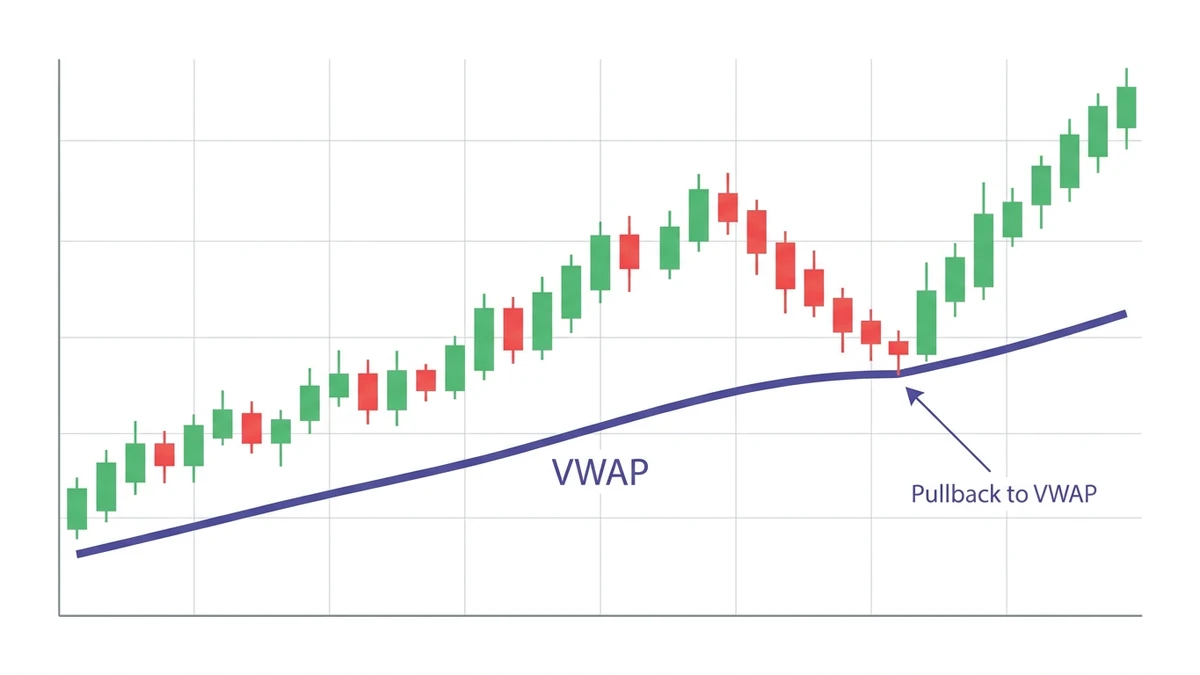
Price opens, builds above VWAP and keeps making higher highs while the line slopes up underneath. Mid-session it pulls back and tags VWAP with a small lower-wick candle. A trader using VWAP as a pullback level would want that rejection candle before entering long, with a stop a little below VWAP, rather than buying the first touch blind. If price closes firmly below VWAP and stays there, the trend read is wrong and the setup is off.
Stretch to the +2 band in a range day
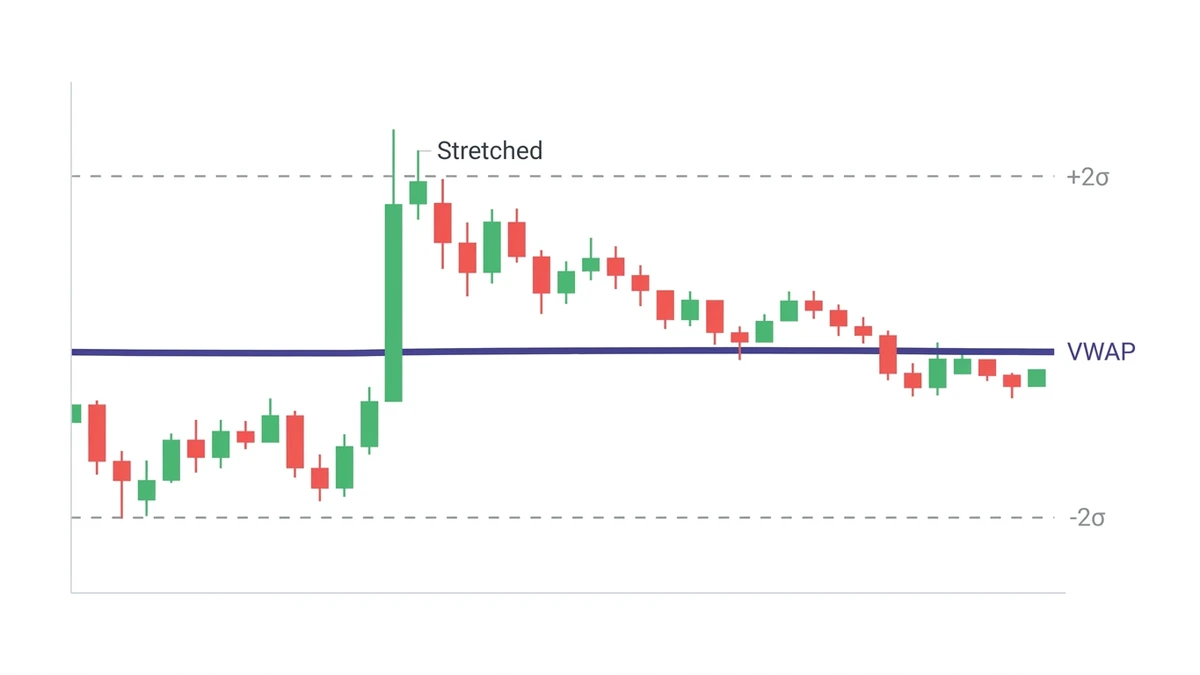
VWAP is flat, which says the session is balanced. A sudden spike runs price up to the +2 band, prints an upper wick and stalls. In a balanced session, that kind of stretch often drifts back toward the average, which is the mean-reversion read. In a trending session, the same touch can just be the start of a bigger move, which is why the slope of VWAP matters more than the band touch itself.
How to calculate VWAP: a 5-bar example
VWAP calculated bar by bar for five one-minute bars. Typical price = (high + low + close) ÷ 3. Illustrative numbers, not real market data.
| Bar | High | Low | Close | Typical price | Volume | Cum. TP × volume | Cum. volume | VWAP |
|---|---|---|---|---|---|---|---|---|
| 1 | 100.40 | 99.80 | 100.10 | 100.10 | 1,000 | 100,100 | 1,000 | 100.10 |
| 2 | 100.60 | 100.00 | 100.30 | 100.30 | 800 | 180,340 | 1,800 | 100.19 |
| 3 | 100.50 | 99.90 | 100.20 | 100.20 | 600 | 240,460 | 2,400 | 100.19 |
| 4 | 100.20 | 99.60 | 99.90 | 99.90 | 1,500 | 390,310 | 3,900 | 100.08 |
| 5 | 100.00 | 99.40 | 99.70 | 99.70 | 2,100 | 599,680 | 6,000 | 99.95 |
What VWAP doesn't tell you, and the mistakes that follow
VWAP is built from the past, so it lags, and it lags more as the day goes on. It doesn't tell you direction, only where the session's average sits. It's an intraday tool: on a daily chart with a session anchor, the line resets every bar and turns into a squiggle around the typical price, which is the most common way people misuse it. Putting a session VWAP on a daily chart is like averaging one number. Technically correct, practically useless. VWAP is also only as good as the volume behind it. Spot forex has no central exchange, so platforms use the broker or data feed's own volume, often tick volume, which reflects how often price changed rather than how much traded. Treat forex VWAP as a rough guide and futures or stock VWAP as the real thing. Thin markets and low-volume hours also let a few large prints yank the line around. The other classic mistakes: comparing today's price with yesterday's VWAP, buying every touch of the line without a rule for when it fails, and treating a band touch as an automatic reversal. None of this makes VWAP useless. It makes it a benchmark you still have to test.
Frequently asked questions
What does the VWAP indicator tell you?
VWAP tells you the average price traded so far in the session, weighted by volume. Price above VWAP means buyers have paid up on average today; price below means sellers have the upper hand. Traders use it as a session bias filter, a pullback level and a fair-value reference, not as a signal on its own.
How do you calculate VWAP?
For each bar, multiply the typical price ((high + low + close) ÷ 3) by its volume and keep a running total from the session open. Divide that by the running total of volume. Both totals reset at the next session. Five bars with volume weighted toward lower prices will give a VWAP below their simple average.
Is VWAP a good indicator for day trading?
It's one of the most useful references for day trading because it resets every session and reflects where volume actually traded. It's not a strategy by itself. A VWAP pullback or mean-reversion rule still needs clear entries, stops and enough tested trades before you trust it.
What is the best timeframe for VWAP?
VWAP is built for intraday charts, from 1-minute to around 15-minute. On a daily chart with a session anchor it resets every bar and stops being useful. For a longer view, switch the anchor to weekly or monthly, or use anchored VWAP from a specific swing or event.
Does VWAP work in forex?
It works, with a caveat. Spot forex has no central exchange, so the volume behind VWAP comes from your broker or data feed, often as tick volume. That makes forex VWAP a rough guide. Currency futures, which trade on an exchange with real volume, give a cleaner VWAP.
What is the difference between VWAP and a moving average?
A moving average weights every bar equally over a fixed lookback, such as the last 20 bars. VWAP weights each bar by its volume and covers the whole session from the open, then resets. So VWAP moves less late in the day, and it reflects where size actually traded.
Does Traders Journal have a VWAP indicator?
Yes. VWAP is a built-in study in Traders Journal's charts and backtesting workspace, with a session anchor, typical-price source and a one-standard-deviation band by default. You can add bands 2 and 3, change the anchor period, and use the Anchored VWAP drawing tool from any bar.