
On this page
A vertical run, one huge candle, then the air goes out
A blow-off top is the final, frantic leg of an uptrend. Price goes almost straight up, the last candle is wide and loud, and the buyers run out. Traders also call it a parabolic top. Wyckoff called it a buying climax. Unlike a double top or a head and shoulders, which take weeks to build and hand you a neckline, a blow-off top arrives in days and hands you nothing until it is over. It only counts as a top if price turns, and most of the time it doesn't. In our test of 802 climaxes, 71.3% made a new high before any close back below the climax candle's low. Three things make one:
- An uptrend that has already run. A blow-off ends a trend. It doesn't start one.
- A vertical run. Price covers a lot of ground in a few candles, far steeper than before.
- A climax candle: tall, on heavy volume, and a new high. It only becomes a top if a later candle closes back below its low.
01Start with an uptrend that has already run
We required price to close above a rising 50-candle average first. A big green candle inside a sideways range is just a big green candle.
02Measure the run, don't eyeball it
Find the shelf: the lowest low of the 10 candles before the run. Then check the run. Ours had to cover at least 4x ATR (the average candle range) from the shelf in 10 candles or fewer, and be at least twice as steep as the 30 candles before it. The shelf matters twice. It proves the move was vertical, and it becomes your target.
03Find the climax candle
The last candle of the run should make a 50-candle high, stand at least 1.5x ATR tall, and trade on at least 2x median volume. That is the textbook buying climax: the widest bar and the heaviest volume of the run, where late buyers pile in and early ones sell to them.
04Treat RSI as a hint, not a trigger
Wilder's RSI above 70 is the usual overbought flag. A blow-off will usually read hot. So will a healthy trend that keeps going. We left RSI out of our test. If you want to use it, replay past parabolic runs and count how often a reading above 70 was followed by a drop, and how often by another leg up.
05Wait for a close below the climax low
Until a candle closes below the climax candle's low, you have a big candle and a hunch. That close is the signal. We gave price 10 candles to do it. If price made a new high first, the setup was dead and we took no trade.
Trade the failure: a close back below the climax candle's low
The textbook idea is to sell the top. The tested idea is to wait until the top proves itself. Some traders wait for a small bounce after the close and sell a bear flag, which lets the stop sit closer but skips any drop that never bounces.
- Entry: short on the first close below the climax candle's low.
- Stop: above the climax high.
- Target: the shelf where the run began.
- Skip rule: if price makes a new high before that close, there is no trade.
- Don't short the climax candle itself. It is the version everyone wants and almost nobody should take. Our early shorts, with the stop 0.25 ATR above the high, reached the shelf first only 16.1% of the time. In 403 of the 572 climaxes that kept rising, that early short was stopped out. Confidence is not a risk plan.
Blow-off top short: the rules we tested
The exact rules behind every number on this page.
| Step | Rule | Why |
|---|---|---|
| Uptrend filter | Price closes above a rising 50-candle average | A blow-off ends a trend. A big green candle in a sideways range is just a big green candle. |
| Shelf | Lowest low of the 10 candles before the run | It proves the move was vertical, and it becomes the target. |
| Run size | At least 4x ATR from the shelf in 10 candles or fewer | Sets how far and how fast the run must go. |
| Run speed | At least twice as steep as the 30 candles before it | A steady climb doesn't count. |
| Climax candle | A 50-candle high, at least 1.5x ATR tall, on at least 2x median volume | The textbook buying climax: widest bar, heaviest volume. |
| Entry | First close below the climax low, within 10 candles | That close is the signal. A new high first means no trade. |
| Stop | The climax high | If price trades above it, the climax was not the top. |
| Target | The shelf | Where the vertical run began. |
| Time limit | Maximum 60 candles per trade | A cap on how long a trade can run. If stop and target sat inside the same candle, we counted a loss. |
The blow-off top target: back to the shelf where the run began
Target = the shelf where the vertical run began; reward:risk = (entry - shelf) / (climax high - entry)
The run was fast, so there is little trading history between the top and the shelf, and price can travel back through that stretch quickly. Here is a worked example, then the honest part.
- Example: shelf at $100, climax high $130, climax low $122, entry close at $120.
- Risk is $130 - $120 = $10. Reward is $120 - $100 = $20. That is 2:1.
- The honest part: in our test the median reward-to-risk was only 0.88:1. By the time a candle closes below the climax low, price has often given back a chunk already, so the shelf is closer than the stop.
- At 0.88:1 you need to win more than half the time just to break even, and the shelf came first in 51.5% of trades. Winners took a median of 6 candles to reach it. The average result was -0.10R before costs and -0.11R after spread.
Shorting the biggest candle on the chart
Every one of these comes from trading the story instead of the count. A chart you already know the ending of makes every top look obvious.
- Shorting the climax candle because it looks like the top. Most of the time it isn't: 71.3% kept rising first.
- Calling any big green candle a blow-off. No shelf, no run, no top.
- Skipping the reward-to-risk check. Measure the shelf distance against your stop distance before you click. If the shelf is closer than the stop, you are risking more than you can make.
- Widening the stop after a new high. The new high already told you the setup failed.
- Quoting a win rate you didn't count.
Our 802-climax test and real charts
Anatomy of a blow-off top, step by step
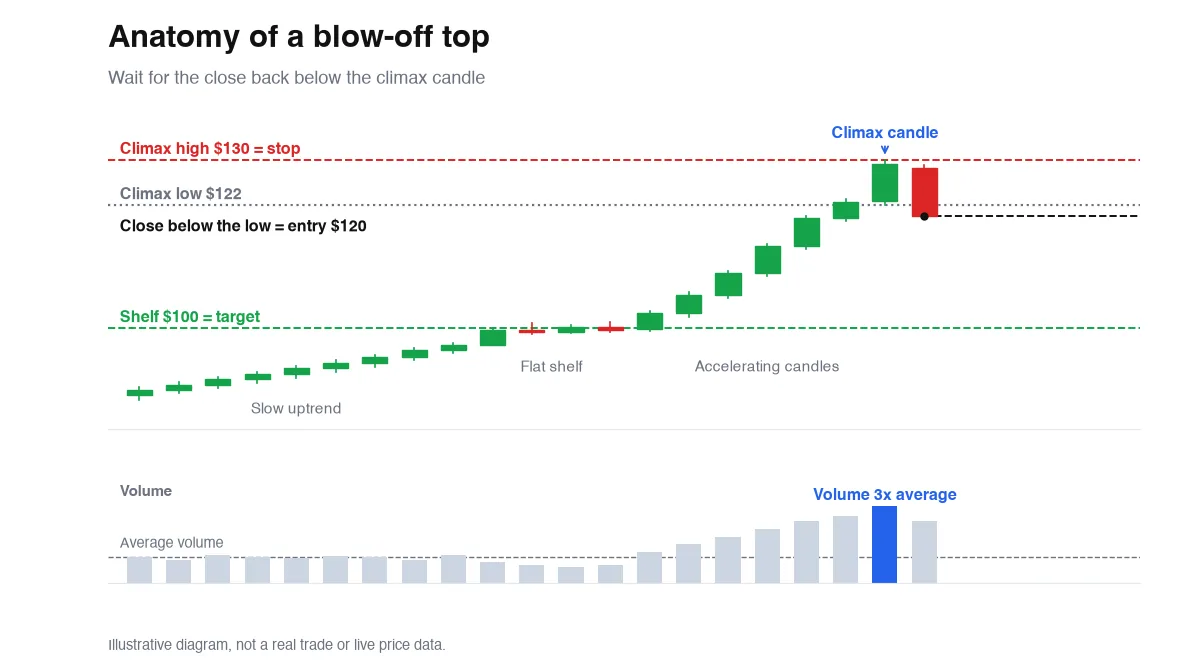
Read it left to right. (1) The shelf: price sits near $100 for a few candles. (2) The run: a near-vertical push up. (3) The climax candle: high $130, low $122, volume about 3x average. Its high is your stop and its low is your trigger. (4) The next candle closes at $120, below the $122 climax low. That is the entry. (5) Stop at $130, $10 away. Target at the shelf, $100, $20 away. A 2:1 trade, on paper.
802 climaxes: most kept rising
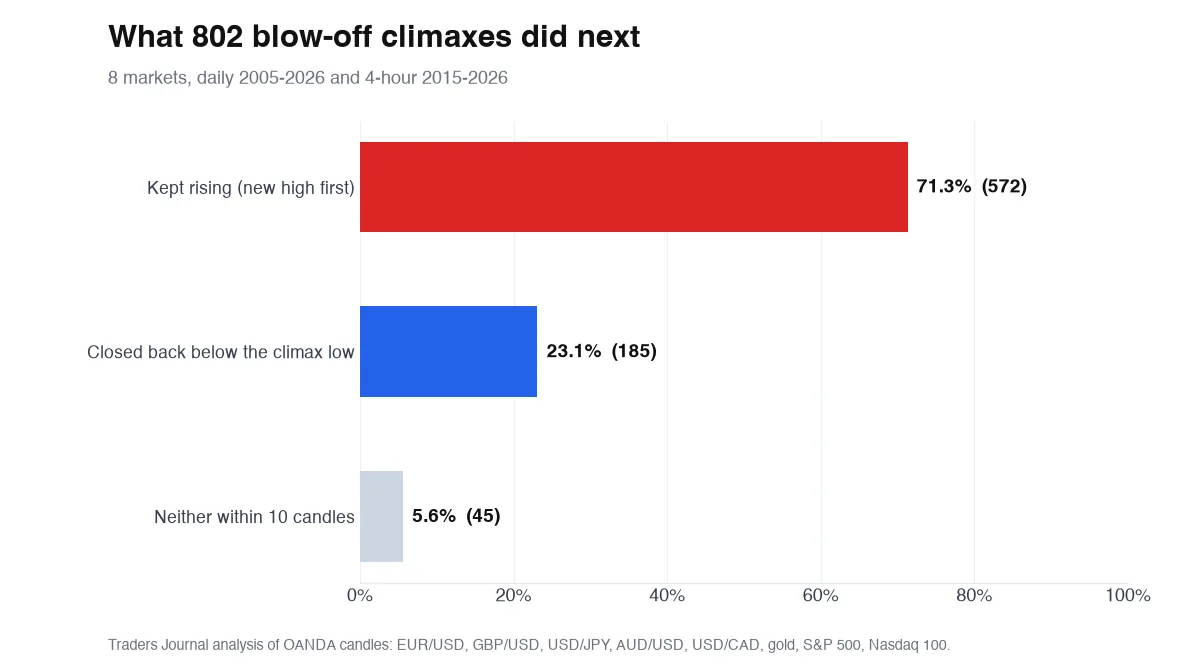
We wrote the rules above into code and ran them on eight markets: five forex pairs, gold, the S&P 500 and the Nasdaq 100. Daily candles from 2005 and 4-hour candles from 2015. That found 802 climaxes, 67 daily and 735 on 4-hour. Then we asked what happened next. 572 of them (71.3%) made a new high before any close below the climax candle's low. 185 (23.1%) closed back below it within 10 candles. 45 (5.6%) did neither. More than seven in ten "blow-off tops" were not tops yet.
Wait for the close: 185 trades, no edge over random entries
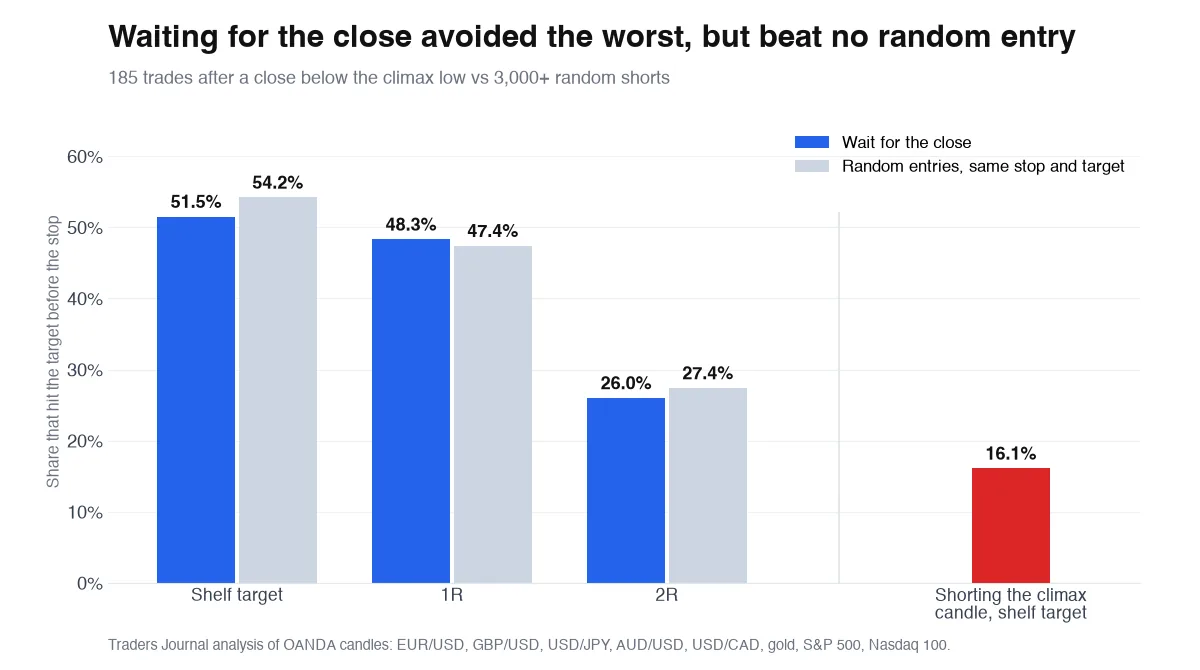
The 185 that closed back down are the trades. Entry on the first close below the climax low. Stop at the climax high. Target the shelf, with 1R and 2R as smaller targets. Maximum 60 candles. If stop and target sat inside the same candle, we counted a loss. For the control we ran 20 random shorts per trade, same market, same timeframe, same stop size in ATR and same target distance. Shelf first: 51.5% against 54.2% for random entries. 1R: 48.3% against 47.4%. 2R: 26.0% against 27.4%. The results table after the examples breaks it down by market and timeframe. Each market had only 14 to 35 trades, so read those gaps as noise, not a map of where to trade. A raw rule that matches random entries is not an edge. It is a starting point.
Gold, January 2026: a win that paid half of what it risked
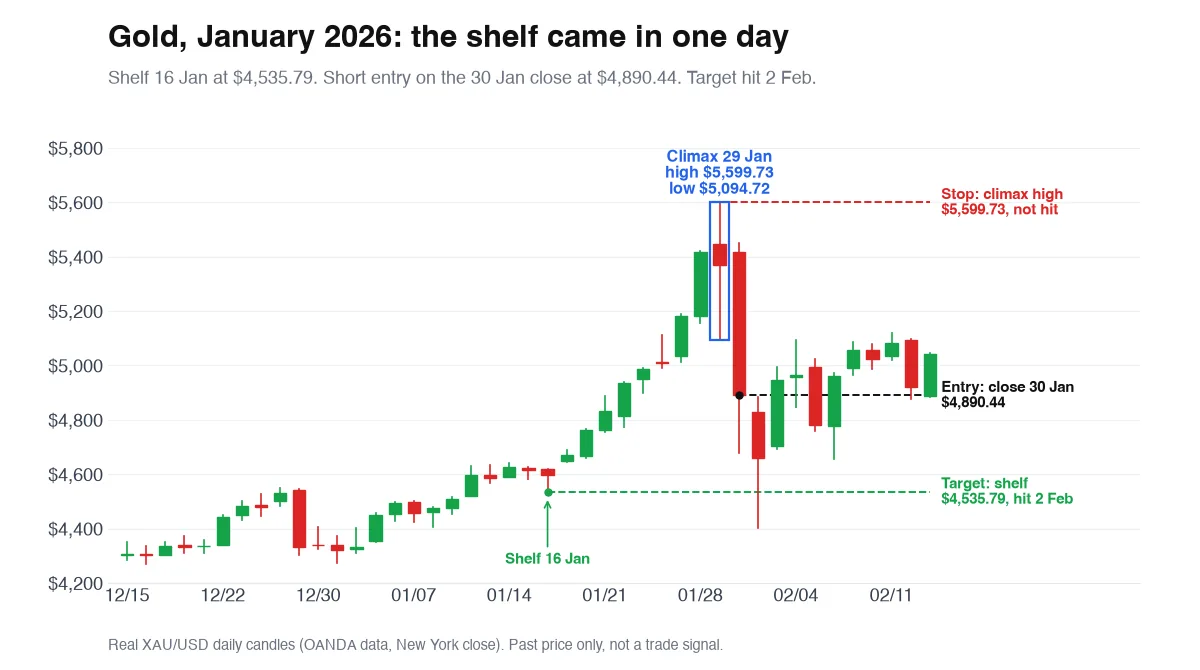
Gold's shelf low was $4,535.79 on 16 January. Then the run: closes of $4,762.63 on 20 January, $4,935.11 on 22 January, $5,007.90 on 26 January and $5,417.64 on 28 January. The climax candle came on 29 January: high $5,599.73, low $5,094.72, close $5,368.53. On 30 January gold closed at $4,890.44, below the climax low. That is the short entry. The stop at the climax high was $709.29 away. The shelf was $354.65 away, about 0.5R. On 2 February gold traded down to $4,401.10 and hit the target. A win, but at that payoff you need two of them to cover one loss. That is the reward-to-risk problem in a single trade.
USD/JPY, March 2022: a textbook top that wasn't
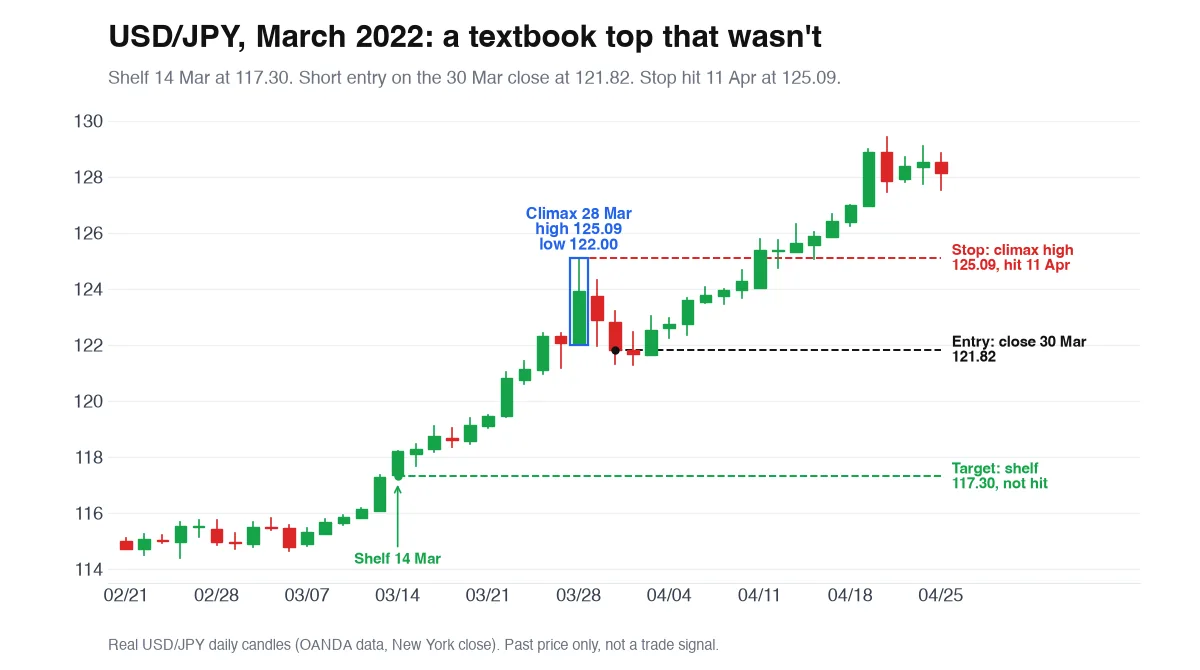
USD/JPY's shelf low was 117.30 on 14 March 2022. The run ended in a climax candle on 28 March: high 125.09, low 122.00, close 123.91. On 30 March it closed at 121.82, below the climax low. Short entry. Stop at 125.09, 3.27 yen away. Target 117.30, 4.52 yen away, about 1.4R. The lowest close after entry was 121.69 on 31 March. It never got near the shelf. Price climbed, and on 11 April it traded to 125.76 and hit the stop. A loss of 1R. That same March 2022 run is the pole of the USD/JPY example on our pennant pattern page, where the trade reached its target at 131.40 in June. One run, two readings, and the market agreed with the second.
Results by market and timeframe
Share of trades that reached the shelf before the stop, against 20 random shorts per trade. Each market has only 14 to 35 trades, so read the gaps as noise.
| Market | Trades | Shelf hit first | Random entries |
|---|---|---|---|
| EUR/USD | 19 | 31.6% | 51.1% |
| GBP/USD | 16 | 56.3% | 56.6% |
| USD/JPY | 15 | 60.0% | 55.4% |
| AUD/USD | 14 | 50.0% | 50.9% |
| USD/CAD | 25 | 64.0% | 57.3% |
| Gold | 35 | 60.0% | 59.1% |
| S&P 500 | 22 | 31.8% | 52.4% |
| Nasdaq 100 | 21 | 52.4% | 46.5% |
| Daily | 23 | 56.5% | 53.7% |
| 4-hour | 144 | 50.7% | 54.3% |
| All | 167 of 185 (14 already past the shelf at entry, 4 still open after 60 candles) | 51.5% | 54.2% |
The two real trades, side by side
Gold and USD/JPY daily candles (OANDA data, New York close). Past price only, not a trade signal.
| Measure | Gold Jan 2026 | USD/JPY Mar 2022 |
|---|---|---|
| Shelf | $4,535.79 (16 Jan) | 117.30 (14 Mar) |
| Climax high (stop) | $5,599.73 | 125.09 |
| Climax low | $5,094.72 | 122.00 |
| Entry close | $4,890.44 (30 Jan) | 121.82 (30 Mar) |
| Risk | $709.29 | 3.27 yen |
| Distance to shelf | $354.65 | 4.52 yen |
| Reward to risk | About 0.5R | About 1.4R |
| Result | Win: target hit 2 Feb, low $4,401.10 | Loss of 1R: stop hit 11 Apr, high 125.76 |
Blow-off top vs double top vs buying climax
Blow-off top vs double top vs buying climax vs exhaustion gap vs V-top: how fast each forms, what volume does, and what it waits for.
| Pattern | Shape | Speed | Volume | Confirmation | Usual target |
|---|---|---|---|---|---|
| Blow-off top | Near-vertical run ending in one tall climax candle | Fast: days | Heavy on the climax candle | Close below the climax candle's low | The shelf where the run began |
| Double top | Two peaks near the same level with a dip between | Slow: weeks to months | Often lighter on the second peak | Close below the dip (neckline) | Pattern height below the neckline |
| Buying climax (Wyckoff) | Widest bar at the end of a markup phase | Fast, inside a longer cycle | Very heavy, the highest of the run | Automatic reaction down, then a secondary test | Bottom of the new trading range |
| Exhaustion gap | A price gap late in a trend | One session | Heavy on the gap day | Gap fills, price closes back inside it | The gap fill |
| V-top | Sharp peak, sharp drop, no pause at the top | Fast both ways | Varies | Break of the last swing low | Back toward where the rise began |
A blow-off top gives you a story. The odds are your job
A blow-off top can't tell you the odds. Here is what we know, and where our own count stops.
- No outside stat we trust. The success rates we found online rarely say what they counted, on which markets, or how they defined a climax, so they aren't worth much.
- Our own count is the stat: 802 climaxes, 71.3% kept rising, and the wait-for-the-close trade matched random entries.
- That count has limits too. One rule set, OANDA candles, eight markets, and only 14 to 35 trades per market. A different definition of climax might find something ours missed.
- The pattern can't show you the top in real time. You only know after the failed candle.
- What to do instead: treat the pattern as a place to look, add the filter you believe in (a level, a session, a trend change), and count whether it works. Our guide on how to backtest a trading strategy shows the counting, and backtesting your own market gives you the number that matters.
Frequently asked questions
What is a blow-off top in trading?
A blow-off top is the final, near-vertical leg of an uptrend, ending in one wide candle on heavy volume before price turns. Traders also call it a parabolic top, and Wyckoff called it a buying climax. In our test of 802 climaxes, most kept rising: 71.3% made a new high before any close below the climax candle's low. The label is only safe in hindsight.
Is a blow-off top bullish or bearish?
Bearish, but it looks bullish while it forms. The run up is as strong as an uptrend gets, which is why it fools people. The bearish part only starts if price closes back below the climax candle's low. Until then, strength is strength. In our test, 23.1% closed back below within 10 candles, and 71.3% made a new high first.
How do you trade a blow off top?
Wait. Short only after a candle closes below the climax candle's low, put the stop above the climax high and target the shelf where the run began. Skip the trade if price makes a new high first. Shorting the climax candle itself reached the shelf first only 16.1% of the time in our test. Even the wait-for-the-close entry matched random entries, so test your filter before risking money.
What is the difference between a blow-off top and a double top?
A blow-off top is fast and vertical: one climax candle after a steep run. A double top is slow: two peaks near the same level with a dip between them, confirmed by a close below that dip. The double top hands you a neckline, a stop and a measured target. A blow-off top hands you the climax candle's low and the shelf where the run began.
Blow-off top vs buying climax: are they the same?
Mostly. Buying climax is the Wyckoff name for the wide, heavy-volume bar at the end of a markup phase. Blow-off top is the common trader's name for the same moment. The difference is context. Wyckoff places the climax inside a larger cycle, followed by an automatic reaction and a secondary test. Blow-off top focuses on the vertical run and the final candle.
What is the difference between a blow-off top and an exhaustion gap?
An exhaustion gap is a single price gap late in a trend. A blow-off top is a whole vertical run ending in a climax candle. They can appear together, but neither needs the other. Forex and other 24-hour markets gap less often, so a blow-off there usually shows up as one very tall candle instead of a gap. A gap that fills quickly adds to the case that the move is spent.
What role does volume play in a blow-off top?
Heavy volume is the textbook sign. The climax candle trades on far more volume than normal as late buyers pile in and early ones sell to them. In our rules, the climax candle had to trade on at least 2x median volume. Even with that filter, 71.3% kept rising first. Treat volume as part of the definition, not proof that the top is in.
Can you spot a blow-off top in real time?
Not reliably. Live, you can see a vertical run and a wide candle on heavy volume. You cannot see whether the next candle makes a new high, and 71.3% of ours did. What you can do is write the setup as rules, mark each one as it forms, and act only after a close back below the climax candle's low. The app does not detect them, so you spot and log each one yourself.
Where do you put the stop on a blow-off top short?
Above the climax candle's high. If price trades above it, the climax was not the top and the trade is wrong. Check the distance before you enter. The median reward-to-risk to the shelf in our test was only 0.88:1, because the close back below the climax low often comes after a big drop. If the shelf is closer than your stop, skip the trade.
What invalidates a blow-off top?
A new high above the climax candle before any close below its low. That kills the setup. It also fails if no candle closes below the climax low inside your window; we allowed 10 candles. In our test, 71.3% made a new high first and 5.6% did neither, so only 23.1% of climaxes ever became a trade.
Does a blow-off top work on any timeframe?
It shows up on any timeframe, but our test found no reliable winner. Daily gave 67 climaxes, and the shelf came first 56.5% of the time against 53.7% for random entries, on just 23 trades. 4-hour gave 735 climaxes and 50.7% against 54.3%. Pick the timeframe you actually trade, define the climax on it, and test there.