

On this page
A steep pole, then a small triangle that pinches shut
The pennant pattern is a short continuation pattern with two parts. The pole is a fast, near-vertical move, usually on heavy volume. The pennant is what follows: a few bars where the highs step down and the lows step up, so two short trendlines close in on each other. Then price leaves the triangle. The textbook says it should leave the way the pole pointed. Pole up, bull pennant. Pole down, bear pennant. The triangle itself has no lean; the pole supplies the direction. In our test, though, price left on the pole's side only 51.8% of the time, so treat the direction as a hypothesis until the breakout candle closes.
01Start with the pole
No pole, no pennant. The move into the pattern has to stand out from everything around it: steep, quick, and ideally on a clear jump in volume. A workable rule: the pole covers at least three times the average bar range (ATR) in ten bars or fewer. That's the rule we used in our test. A small triangle in the middle of a slow drift is just a triangle.
02Keep the pennant small and short
The triangle should be small next to the pole and brief. StockCharts puts the range at one to 12 weeks, ideally one to four, on a daily chart. Past 12 weeks, call it a symmetrical triangle instead. In our data the typical pennant lasted five daily candles or four 4-hour candles. A useful size check: the pennant shouldn't give back more than half the pole. If it does, the pause has turned into a pullback.
03Check the lines converge rather than run parallel
Draw one line along the pennant's highs and one along its lows. If they pinch toward a point, it's a pennant. If they run parallel and slope against the pole, it's a flag. Same family, different shape. The shape also decides where your breakout line sits, so get it right before you set an alert.
04Watch volume fade inside the pennant
Volume usually dries up while the pennant forms and comes back on the break. That's the textbook view. In our 4-hour data, pennants where volume faded hit their target 19.9% of the time, against 20.8% where it didn't. So use the fade to help you spot the pattern, and don't expect it to tell you the breakout will work.
05Wait for a close outside the lines
The pattern isn't finished until a candle closes outside the triangle. A wick poking through and snapping back doesn't count. Until that close, you have a pause, and pauses can resolve either way.
Wait for a close outside the triangle, in the pole's direction
The usual entry is a candle close outside the pennant on the pole's side: above the upper line for a bull pennant, below the lower line for a bear pennant. If the first close lands on the wrong side, skip the trade. That happened to 48.2% of the pennants we found. The stop goes beyond the opposite side of the pennant: below its low for a bull pennant, above its high for a bear one. A real breakout shouldn't need to trade back through the whole pattern. Some traders wait for a retest of the broken line to get a tighter stop, and accept that the fastest breakouts never come back. Because the stop sits close and the target sits a full pole away, the plan usually offers about 3:1 reward to risk. That only pays if the target gets hit at least 1 time in 4.
The pennant pattern target: the pole's length, measured from the breakout
Target = breakout price ± pole length
Measure the pole from where the sharp move started to its top (or bottom). Add that distance to the breakout price for a bull pennant, subtract it for a bear one. Example: a stock runs from $40 to $50, so the pole is $10. A pennant forms and breaks out at $49. The target is $49 + $10 = $59, with a stop just under the pennant's low, say $46.50. That's $2.50 of risk for $10 of potential reward. Use the target as a reference, not a promise. In our test, counting every breakout that went the pole's way, price touched the full pole within 20 candles only 9.3% of the time on daily charts and 17.5% on 4-hour charts, and touched half the pole about 45% of the time. Allowing up to 60 candles and requiring the target before the stop, the full pole won 19.8% and half the pole 36.5%.
Calling every small triangle a pennant
The biggest mistake is skipping the pole. Without a sharp move into it, a small triangle is a pause with no direction attached. Next comes jumping in before the break because the pennant 'looks ready'. Nearly half the pennants in our test broke the wrong way first, and an early entry takes that risk for no better price. Third, treating a pennant that has dragged on as if it were fresh. The longer it lasts, the more it behaves like a symmetrical triangle, and the less the pole's direction matters. Last, trusting the full-pole target as a near-certainty. It's the textbook number, and in our data it was the least likely outcome of every target we tried.
Our 1,208-pennant test and real charts
Anatomy of a bull pennant, step by step
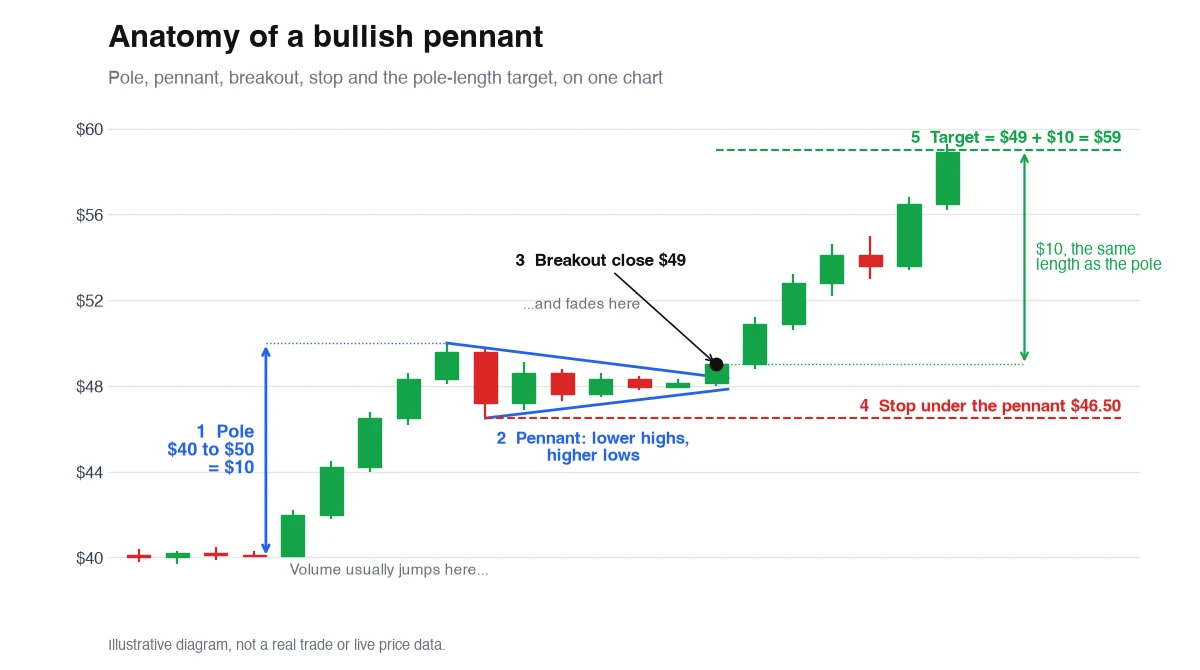
Read it left to right. (1) Price runs from $40 to $50 in five candles: that's the pole. (2) It pauses in a small triangle where each high is a little lower and each low a little higher. (3) A candle closes above the upper line at $49: that's the breakout and the entry. (4) The stop goes under the pennant's low at $46.50, $2.50 away. (5) The target is the pole's $10 added to the breakout: $59. Volume typically swells during the pole and dries up inside the pennant.
We tested 1,208 pennants. None of the targets beat a random entry.
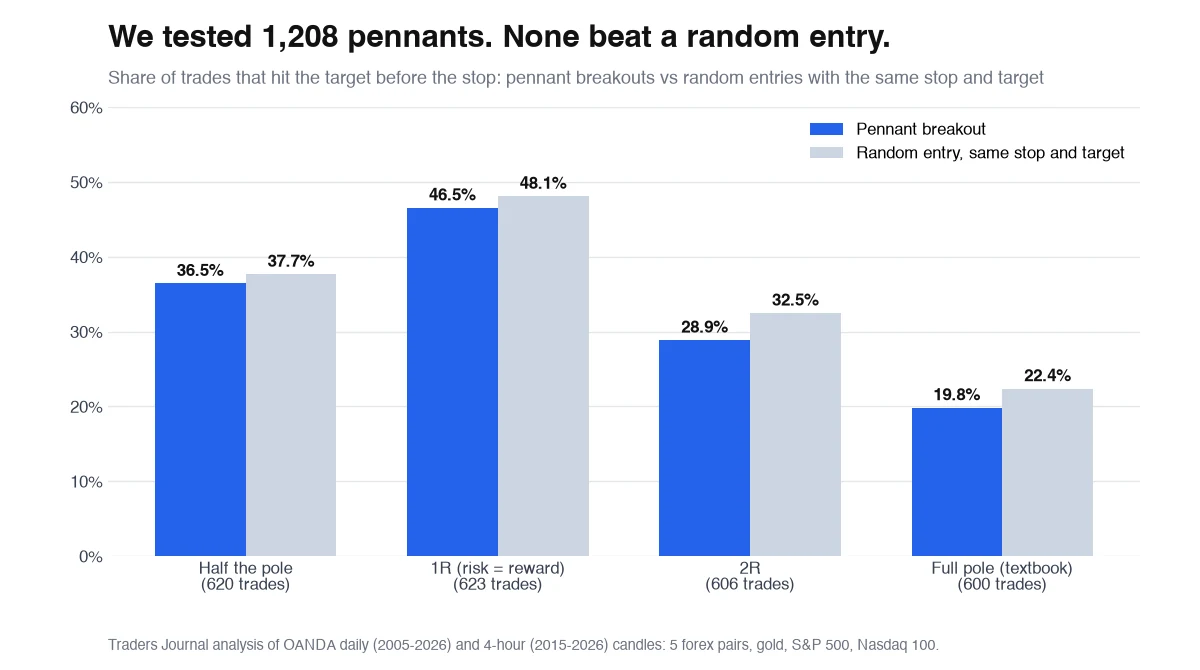
We wrote the textbook rules into code and ran them on eight markets: five forex pairs, gold, the S&P 500 and the Nasdaq 100. Daily candles from 2005 and 4-hour candles from 2015. Pole: at least 3x ATR in 3 to 10 candles. Pennant: 4 to 15 candles, highs sloping down, lows sloping up, giving back no more than half the pole. Entry on the first close outside the lines; stop beyond the pennant's far side. That found 1,208 pennants (218 daily, 990 on 4-hour). Only 626 (51.8%) broke the pole's way. Of those trades, the full pole target came before the stop 19.8% of the time. Random entries in the same direction with the same stop and target distances hit 22.4%. With a typical 3.2:1 payoff you need about 24% to break even, so the textbook trade averaged a loss of about 0.12R per trade. Smaller targets didn't fix it: half the pole hit 36.5% vs 37.7% at random, 1R hit 46.5% vs 48.1%. Results swung by market, from 28.4% target-first on the Nasdaq 100 to 11.1% on the S&P 500. That spread is why your own market matters more than anyone's average. A strict, mechanical rule set turned up no edge in these markets; a hand-picked one might, and that is what testing is for.
USD/JPY, April 2022: the target came, two months and one scare later
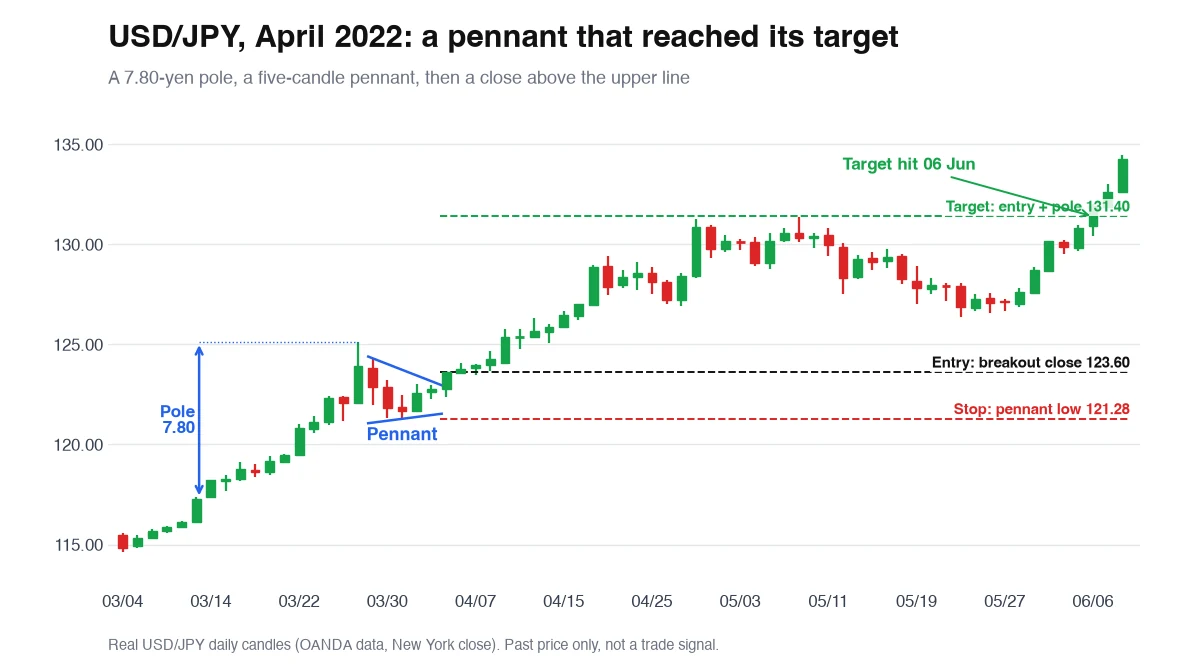
USD/JPY climbed from 117.31 on 14 March to 125.11 on 28 March: a 7.80-yen pole. The next five candles formed a pennant with highs falling from 124.31 to 122.96 and lows rising from 121.28 to 122.27. On 5 April a candle closed at 123.60, above the upper line. Stop under the pennant at 121.28: 2.32 yen of risk. Target 123.60 + 7.80 = 131.40, a 3.4:1 payoff. Price got to 131.35 on 9 May, five pips short, then fell back to 126.36 by 24 May. The target finally hit on 6 June, 44 trading days after entry. A textbook win that most traders would have closed early, and the reason exits deserve as much testing as entries.
Gold, March 2025: a clean breakout that ended at the stop
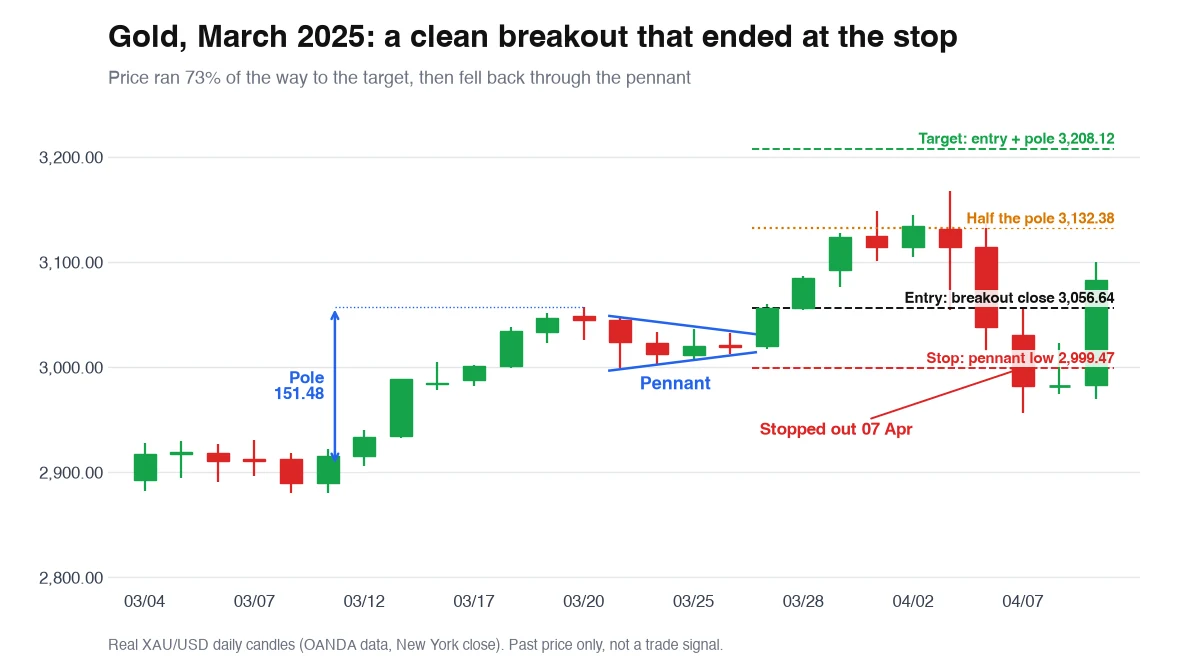
Gold rose from $2,906.11 on 12 March to $3,057.59 on 20 March: a $151.48 pole. Four quiet candles formed a tight pennant between $2,999.47 and $3,047.55. On 27 March gold closed at $3,056.64, above the upper line. Stop at $2,999.47 ($57.17 of risk), target $3,208.12. Gold ran to $3,167.84 on 3 April, 73% of the way to the target and well past the half-pole mark at $3,132.38. Then it reversed. On 7 April it traded down to $2,956.57 and took out the stop. Same shape, same rules, opposite result. A trader taking half the pole would have banked about 1.3R. The full-pole trader lost 1R. That's the trade-off our test measured across all 1,208 pennants.
Pennant, flag or symmetrical triangle: the three shapes side by side
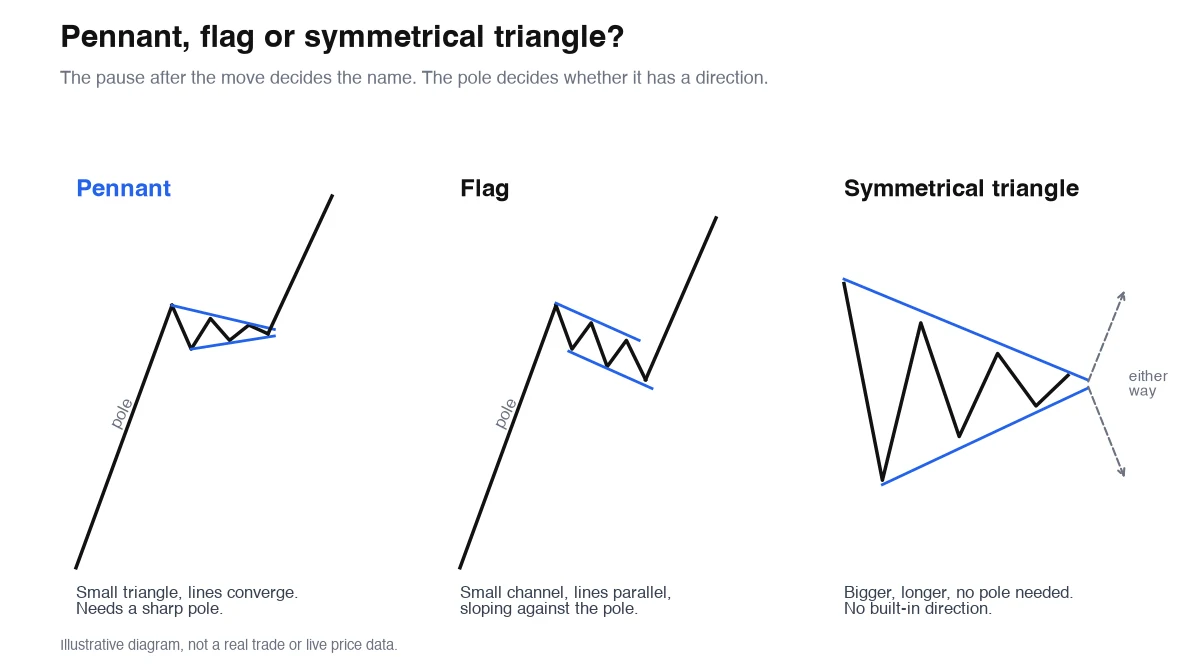
All three pinch or pause, which is why they get mixed up. The pennant and flag both need a sharp pole and are short. The difference is the lines: converging for a pennant, parallel for a flag. A symmetrical triangle is bigger, takes longer, needs no pole, and has no built-in direction. If your pennant keeps going for weeks past the pole, re-label it.
Pennant vs. flag vs. triangle
Pennant vs flag vs symmetrical triangle: the shape of the pause, and what came before it, tells you which one you have.
| Pattern | Shape of the pause | Needs a sharp pole? | Direction | Typical length |
|---|---|---|---|---|
| Pennant | Small triangle, converging lines | Yes | Same as the pole | Short: a few bars to ~4 weeks on daily |
| Flag | Small channel, parallel lines sloping against the pole | Yes | Same as the pole | Short: similar to a pennant |
| Symmetrical triangle | Larger triangle, converging lines | No | Either way; no built-in lean | Longer: weeks to months |
A pennant gives you a shape. The odds are your job
It can't tell you the odds. Win rates quoted online change from site to site, built on different samples, markets and definitions. Our own count, 1,208 pennants on eight markets, found no edge over random entries with the same stop and target, and a spread from 11% to 28% target-first depending on the market. It can't tell you timing either. Some pennants break within a few bars, others wander until they stop being pennants, and a winning target can take two months to arrive. And a close outside the triangle can still fail and snap back. Treat the pennant as a place to look, then add the filter you believe makes it work (trend, session, a level) and count whether it does. The only win rate worth trusting is the one you count yourself, on the market and timeframe you trade.
Frequently asked questions
Is a pennant pattern bullish or bearish?
Either. A pennant takes its direction from the pole before it: a sharp move up makes a bull pennant, a sharp move down makes a bear pennant. It only counts as the continuation trade when price breaks out the same way the pole pointed.
Do pennant patterns actually work?
Not on their own, in our test. We coded the textbook rules and found 1,208 pennants on forex, gold and indices. Only 51.8% broke the pole's way, and the full-pole target hit before the stop 19.8% of the time, against 22.4% for random entries with the same stop and target. Any edge has to come from a filter you add and test.
What is the difference between a pennant and a flag?
Both follow a sharp pole and both are short pauses. A pennant's pause is a small triangle with converging lines. A flag's is a small channel with parallel lines, usually sloping against the pole.
What is the difference between a pennant and a symmetrical triangle?
A pennant is small, short and needs a sharp pole, which gives it a direction. A symmetrical triangle is bigger, lasts longer, needs no pole and has no built-in lean. A pennant that drags on for months is better read as a symmetrical triangle.
How long does a pennant take to form?
StockCharts gives one to 12 weeks on a daily chart, ideally one to four. In our data the typical pennant lasted five daily candles or four 4-hour candles. Past 12 weeks it is better read as a symmetrical triangle.
How do you set a pennant price target?
Measure the pole and add it to the breakout price (bull pennant) or subtract it (bear pennant). A $10 pole breaking out at $49 gives a $59 target. Treat it as a reference: in our test price touched the full pole within 20 candles after only 9% to 18% of breakouts, and with up to 60 candles it came before the stop 19.8% of the time.
Where do you put the stop loss on a pennant?
Just beyond the opposite side of the pennant: under its low for a bull pennant, above its high for a bear pennant. In our test that stop sat about a third of the pole away from entry, which is what gives the trade its typical 3:1 payoff.
Does volume confirm a pennant breakout?
Volume usually fades inside the pennant and rises on the break, and that helps you spot the pattern. In our 4-hour data it didn't predict the result: pennants with fading volume hit their target 19.9% of the time, and those without hit 20.8%.
What timeframe is best for trading pennants?
Pennants show up on every timeframe. Higher timeframes give fewer, cleaner pennants. Lower timeframes give more, with more noise. In our test the 4-hour chart gave 990 pennants against 218 on the daily over a longer period. Pick the timeframe you actually trade and test it there.