
On this page
One candle that fits completely inside the one before it
The inside bar pattern has two candles. The first is the mother bar. The second is the inside bar: its high is lower than the mother bar's high, and its low is higher than the mother bar's low. Wicks count. If any part of the second candle pokes out, it isn't an inside bar. Some traders only compare candle bodies and ignore wicks. That finds more patterns and looser ones. We use the full range, because the mother bar's high and low are where the orders go. The inside bar itself is neutral. It isn't bullish or bearish. It tells you the market made a smaller candle than the last one, which means a pause. The trade comes later, when price leaves the mother bar. In our test that break went up 52.4% of the time, which is close enough to a coin flip that the candle colour shouldn't sway you.
01Check both ends: high below, low above
Compare the second candle with the first. The high must be below the mother bar's high and the low must be above the mother bar's low. Both, not one. A candle with a lower high but a lower low is a smaller candle, not an inside bar. Equal highs or lows are a grey zone. We left them out of our test to keep the rule strict.
02Size up the mother bar against its ATR
This is the check most guides skip, and in our data it mattered more than anything else. Compare the mother bar's range with the 14-candle ATR (the average true range, a normal candle's size lately). When the mother bar was smaller than 0.75x ATR, the break hit 2R before the stop 43.1% of the time. When it was bigger than 1.25x ATR, it hit 33.8%, against 33.0% for random entries: no real edge. A huge mother bar gives you a wide stop and no edge in return.
03Note where it sits on the chart
An inside bar in a trend is usually read as a pause before the trend continues. One at a key level, after a long run, is read as a possible turn. That's the textbook view, and it's useful for picking which inside bars to look at. Don't expect the trend to pick the direction for you, though. In our test, breaks with the trend and breaks against it hit 2R at almost the same rate: 35.8% and 35.7%.
04Several inside bars in a row: keep the first mother bar
Sometimes two or three inside bars stack up inside the same mother bar. The range is still the mother bar's range, so the entry and stop stay on its high and low. Re-drawing the levels on each smaller candle moves your stop in closer and invites the market to tag it.
We traded 28,894 inside bars. The raw edge was thin; small mother bars did best.
We coded the textbook rules and ran them on eight markets: five forex pairs, gold, the S&P 500 and the Nasdaq 100. Daily candles from 2005 (gold from 2006), 4-hour candles from 2015. We first removed 4,033 stub candles, mostly short weekend fragments that would have shown up as fake inside bars, which left 192,139 candles. An inside bar was any candle strictly inside the one before it. That found 31,235. Entry was a stop order at the mother bar's high or low, live for 10 candles. The stop sat at the other side of the mother bar. In 2,046 cases both sides broke in the same candle and we couldn't tell which came first, and 295 never broke within 10 candles, so we left both out. That left 28,894 trades. With a 2R target, 35.8% hit the target before the stop. Random entries in the same direction with the same stop and target distance hit 33.1%. At 2R, breakeven is 33.3%, so the raw pattern made about +0.07R per trade before costs and about +0.04R after the assumed spread. That's thin. The useful finding was mother bar size. Inside bars with a mother bar under 0.75x ATR (3,177 trades, about 1 in 9) hit 2R 43.1% of the time against 32.6% at random, about +0.23R per trade after spread. That held on all eight markets (40.4% to 46.5%) and in both halves of the data (43.1% before 2020 and 43.1% since). Mother bars over 1.25x ATR, about half of all trades, hit 33.8% against 33.0% at random: no real edge.
Source: Traders Journal analysis of OANDA daily (2005-2026; gold from 2006) and 4-hour (2015-2026) candles, weekend stub candles removed: EUR/USD, GBP/USD, USD/JPY, AUD/USD, USD/CAD, gold, S&P 500 and Nasdaq 100. Spread assumed per trade: 1 to 1.8 pips on forex, $0.30 on gold, 0.5 to 1.5 points on the indices.
Put stop orders on the mother bar's high and low, stop on the other side
The usual plan is two pending orders: a buy stop just above the mother bar's high and a sell stop just below its low. Whichever fills first is the trade; cancel the other. The stop goes at the opposite end of the mother bar, so your risk is the mother bar's range. The target is a multiple of that risk. We tested 1R and 2R. At 1R the trade won 53.2% of the time against 49.2% at random. At 2R, 35.8% against 33.1%. Some traders wait for a candle to close outside the mother bar before entering, to avoid fake breaks. In our test that made things worse. Feeling safer and being safer aren't the same thing. Entering at the close means a worse price and a wider stop, and it hit 2R only 32.5% of the time, below the 33.3% breakeven. A tighter stop at the inside bar's far side is another popular tweak. It looks better on paper. In our test it hit 2R only 30.3% of the time, below breakeven, for about -0.09R a trade before costs. Part of the reason: 46.1% of breakout candles closed back inside the mother bar. Skip inside bars whose mother bar is more than about 1.25x ATR. In our data they were about half of all setups and showed no edge.
Trading every inside bar the same way
The biggest mistake is treating all inside bars as equal. A big mother bar after a news spike is a different trade from a small one in a quiet market, and our test says only the small ones paid. Second, waiting for a close outside the mother bar because it feels safer. It feels safer. In our data it removed the edge. Third, putting the stop at the inside bar's low because the risk looks nicer. In our test that version hit 2R 30.3% of the time, against 35.8% with the stop at the mother bar. Fourth, trusting the trend to pick the direction. Breaks with and against the trend did the same in our test, except on gold. Last, re-drawing the entry on every new inside bar in a stack. The mother bar's levels are the ones that matter.
Charts and real trades
Anatomy of an inside bar trade, step by step
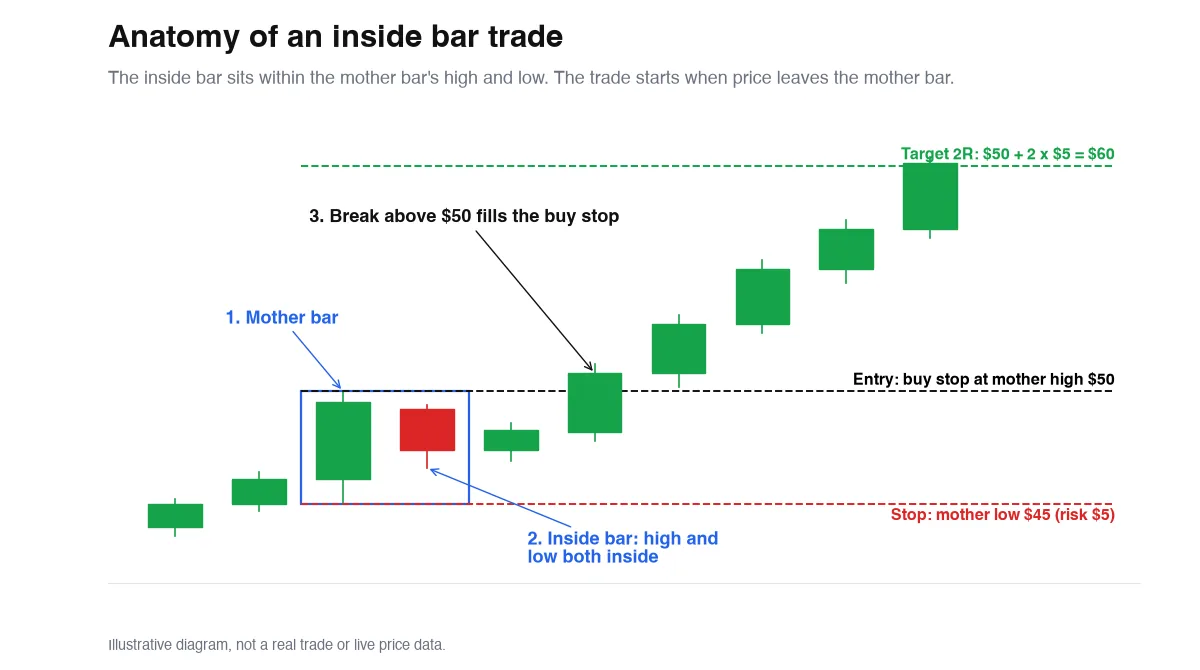
Read it left to right. (1) The mother bar runs from $45 to $50. (2) The next candle stays inside: its high is under $50 and its low is over $45. A second small candle also stays inside, which changes nothing. (3) Price breaks above $50 and fills the buy stop. A sell stop at $45 would have caught a break down instead; once the buy fills, cancel it. (4) The stop sits at the mother bar's low, $45, so the risk is $5. (5) A 2R target is $50 + 2 x $5 = $60.
28,894 trades: how the entry choice changed the result
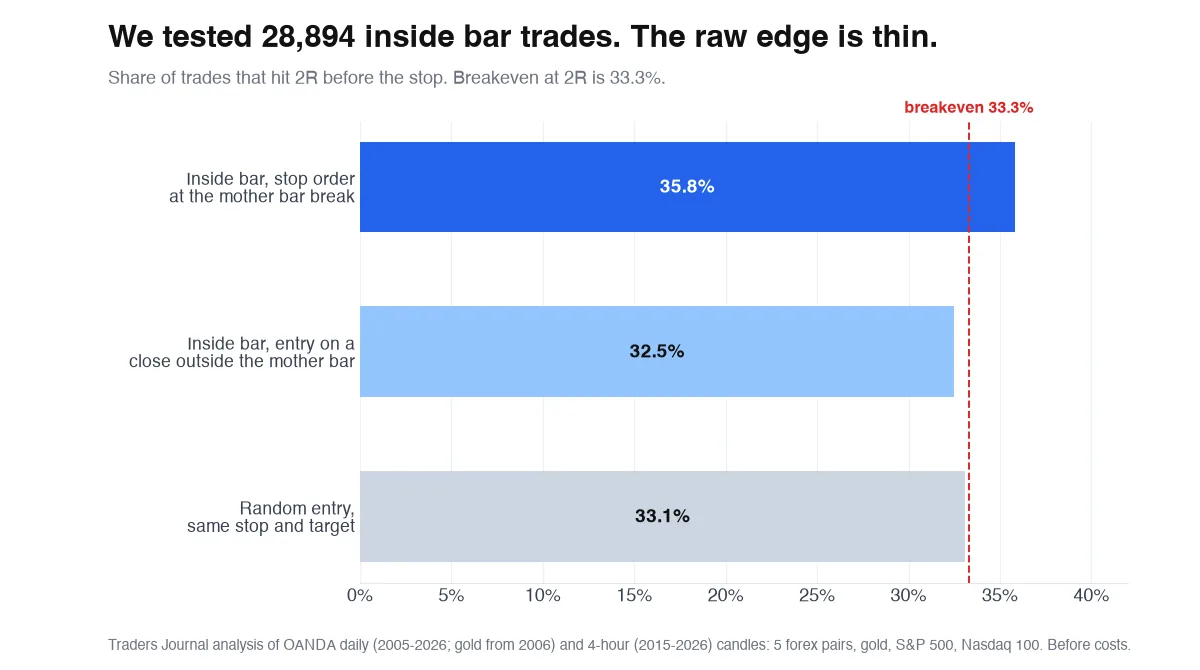
Same inside bars, same stop at the mother bar's far side, same 2R target. Only the entry changes. A stop order at the break hit 2R 35.8% of the time, a little above the 33.3% breakeven. Waiting for a candle close outside the mother bar dropped that to 32.5%, below breakeven and below the 33.1% that random entries managed. The close-based entry got in later and needed a stop a median 1.27 mother bars away, so the 2R target sat further out too. Results by timeframe were close: 35.5% on daily and 35.8% on 4-hour. By market they ranged from 34.1% on AUD/USD to 37.6% on gold.
Mother bar size split the winners from the rest
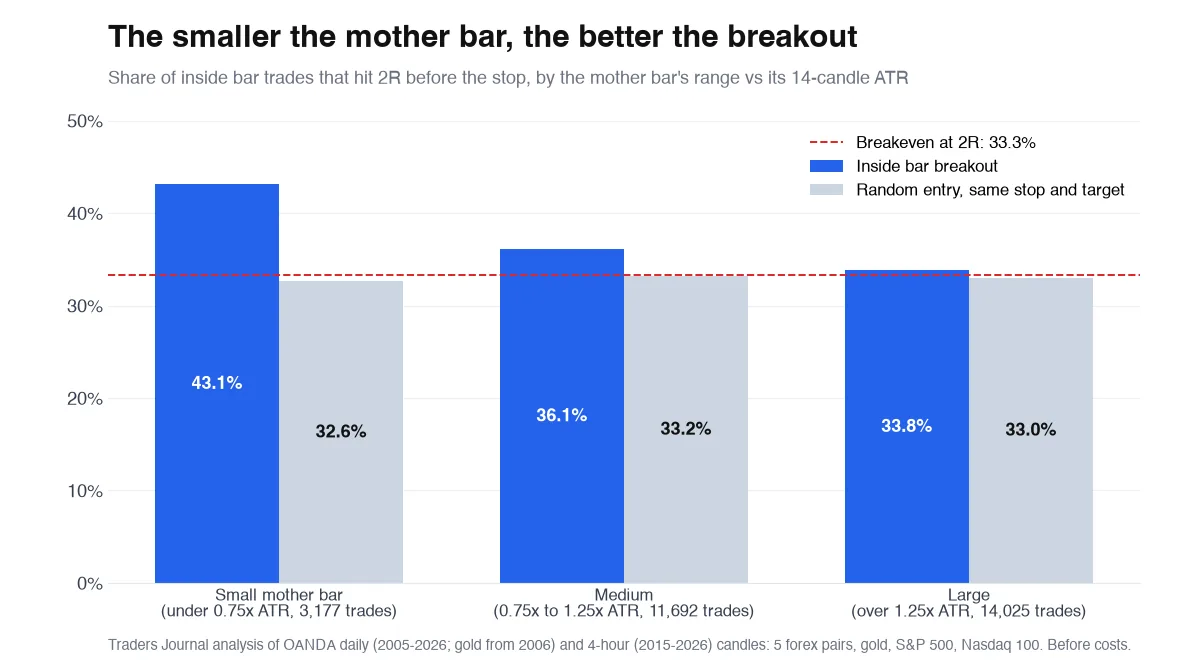
We sorted every trade by the mother bar's range divided by the 14-candle ATR. Small mother bars, under 0.75x ATR, hit 2R 43.1% of the time against 32.6% for random entries. Medium ones, 0.75x to 1.25x, hit 36.1% against 33.2%. Large ones, over 1.25x ATR, hit 33.8% against 33.0%: no real edge, and about half of all trades. We checked whether the small-bar result was a fluke of one market or one decade. Every one of the eight markets landed between 40.4% and 46.5%, and the hit rate was 43.1% both before 2020 and after. A small mother bar is a quiet candle followed by an even quieter one. Our test shows that this squeeze paid more often; it doesn't show why, so treat the reason as a guess and the number as the fact.
Gold, January 2025: an inside bar that reached 2R
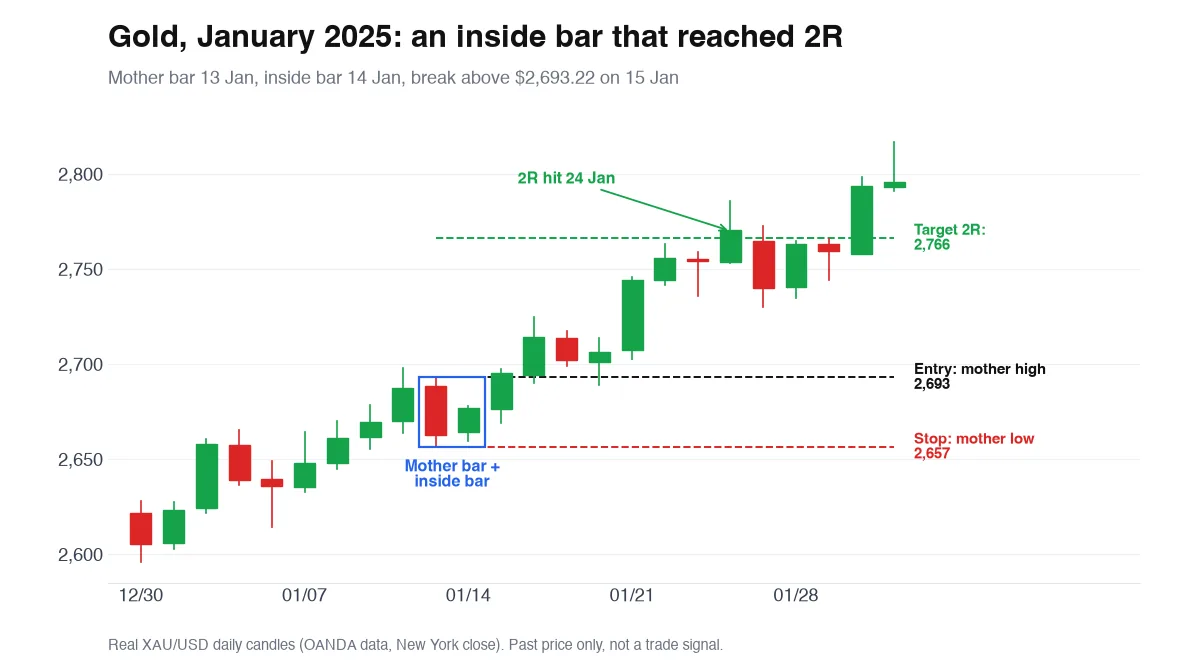
Gold's 13 January 2025 candle ran from $2,656.61 to $2,693.22: the mother bar. On 14 January gold traded between $2,659.64 and $2,678.21, inside it. On 15 January price climbed through $2,693.22 and filled the buy stop. Stop at the mother bar's low, $2,656.61: $36.61 of risk. 2R target: $2,693.22 + $73.22 = $2,766.44. Gold kept climbing and tagged the target on 24 January, seven candles after entry. The mother bar was about 1.14x ATR, a medium one. This is the textbook version going right, in a market that was trending hard at the time.
EUR/USD, February 2025: a half-pip break that failed
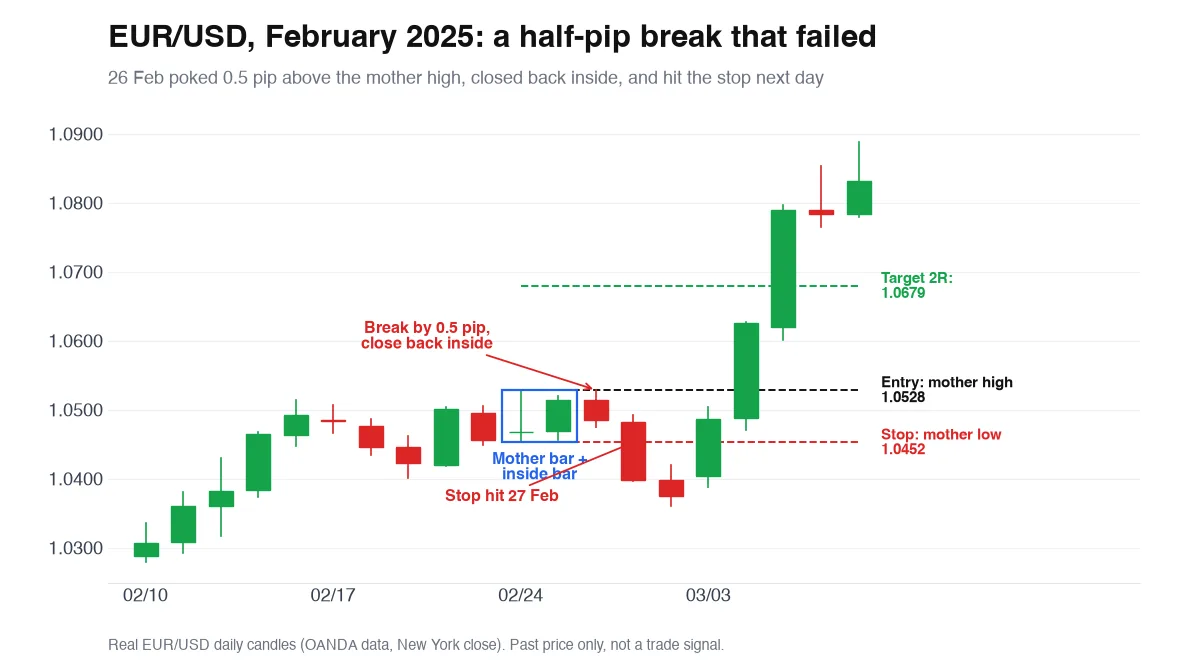
EUR/USD's 24 February 2025 candle ran from 1.04524 to 1.05280. The 25 February candle stayed inside, from 1.04559 to 1.05191, and closed near its high at 1.05145. Looks ready. On 26 February price reached 1.05285, half a pip above the mother bar's high, filled the buy stop, and then closed at 1.04845, back inside. On 27 February it fell through 1.04524 and took the stop: 75.6 pips, 1R gone. Then the annoying part. By 5 March EUR/USD had reached 1.0797, past the 1.0679 target. Right direction, wrong week. This is the 46.1% of breakout candles that close back inside the mother bar, and the reason the stop belongs at the mother bar's far side, not closer.
Inside bar vs. similar patterns
Inside bar vs outside bar vs pennant vs doji: what each shows, and how it is usually traded.
| Pattern | What it looks like | What it shows | Usual trade |
|---|---|---|---|
| Inside bar | A candle fully inside the previous candle's high and low | A pause; range shrinking | Break of the mother bar's high or low |
| Outside bar | A candle whose high and low both exceed the previous candle's | A range expansion; both sides tested | Often read with the close: strong close up or down |
| Pennant | A sharp pole, then a small triangle over several candles | A pause after a strong move | Break in the pole's direction |
| Doji | One candle whose open and close are almost equal | Indecision inside one candle | Needs the next candles to confirm a side |
An inside bar marks a pause. Your test decides if it pays
Our numbers come from eight markets, two timeframes and one set of rules. Change any of them and the result can change. The edge on the raw pattern was thin, about +0.04R a trade after the assumed spread (1 to 1.8 pips on forex, $0.30 on gold, 0.5 to 1.5 points on the indices), and a wider spread or slippage on fast breaks can eat it. Small mother bars did better, but they're only about 1 in 9 setups, and a small risk in pips makes spread a bigger share of each trade. The test had no news filter, no session filter and no volume, so it says nothing about those. It also can't tell you how you'll handle a run of stopped-out breaks, and you only find that out by trading through one. Don't copy claims, ours included. Test them. Use our numbers as a starting point, then replay inside bars on your market and timeframe, with your exact rules, and count your own.
Frequently asked questions
What does an inside bar mean in trading?
An inside bar is a candle whose high and low both sit inside the candle before it, the mother bar. It means the market made a smaller range than the last candle: a pause. On its own it doesn't say which way price will go. Traders watch for price to break the mother bar's high or low.
What does a bullish inside bar mean?
There's no built-in bullish inside bar. Traders call one bullish when it forms in an uptrend or when price breaks above the mother bar's high, and some also look for a green inside candle. In our test of 28,894 trades the break went up 52.4% of the time, close to a coin flip, so wait for the break instead of guessing from the candle colour.
What is the inside bar candlestick strategy?
The common version: put a buy stop above the mother bar's high and a sell stop below its low, take whichever fills, cancel the other, put the stop at the mother bar's far side and aim for 2R. In our test that hit 2R 35.8% of the time against 33.1% for random entries, and 43.1% when the mother bar was small (under 0.75x ATR).
What is a mother bar?
The mother bar is the candle right before the inside bar. Its high and low set the box the inside bar sits in, and they're the levels you trade: entry on a break of one side, stop at the other.
Do inside bars actually work?
Barely, on their own. In our test, 35.8% of inside bar breaks hit 2R before the stop, against 33.1% for random entries and a 33.3% breakeven. That's about +0.04R a trade after an assumed typical spread. Inside bars with a small mother bar (under 0.75x ATR) did much better: 43.1%.
Where do you put the stop loss on an inside bar trade?
The common answer is the far side of the mother bar: its low for a long, its high for a short. A tighter stop at the inside bar's far side looks better on paper. In our test it hit 2R only 30.3% of the time, against 35.8% with the stop at the mother bar's far side.
Should you wait for a candle to close outside the mother bar?
In our test, no. Waiting for a close outside gave a later entry and a wider stop, and those trades hit 2R 32.5% of the time, below the 33.3% breakeven. A stop order at the break did better at 35.8%.
What is a 3 bar pattern?
Traders use the name for a few different setups. With inside bars it usually means three candles: the mother bar, the inside bar and the candle that breaks out of the mother bar. Others mean the three-bar reversal, a separate pattern where the middle candle makes the extreme and the third candle closes back past the first.
Does an equal high or low count as an inside bar?
Traders disagree. The strict rule needs the high below and the low above the mother bar's, and that's the rule we used. If you count equal highs or lows, test that version separately so you know whether it changes anything.
What timeframe is best for inside bars?
They show up on every timeframe. In our test the daily and 4-hour charts gave almost the same result: 35.5% and 35.8% of trades hit 2R. Lower timeframes give more setups and more noise, and spread costs take a bigger bite. Test the timeframe you actually trade.
What is the difference between an inside bar and an outside bar?
An inside bar fits within the previous candle's range: the market got quieter. An outside bar does the opposite: its high is above and its low is below the previous candle's, so the market got wider and tested both sides.
Should you only trade inside bars with the trend?
That's the common advice, and it didn't hold up in our test. Breaks with the trend (judged by the 50-period average) hit 2R 35.8% of the time, and breaks against it hit 35.7%. Gold was the exception, at 40.1% with the trend and 34.8% against it.