
On this page
A zone is the base a sharp move left behind
Supply and demand zones are areas where price paused before a sharp move. Look at where that move began. Just before most sharp moves, price sits in a tight base: one to a few small candles going nowhere. That base is the zone. A demand zone is a base that launched a sharp move up, on the idea that buy orders sat there and some may still be. A supply zone is a base that launched a sharp move down. When price comes back, traders watch for the same reaction. It is an area, not a line, so you draw it from the base's high to its low. In our test the typical zone was about two-thirds of an average candle's range tall, and price came back to 83% of them, after a median of 18 candles.
01Find the sharp move first
Zones only exist because of what left them. Look for a run of large candles that covers far more ground than the bars before it. In our test we required a close at least two average candle ranges (2x ATR) beyond the base within three candles. A slow grind away from a level doesn't leave a zone worth marking.
02Mark the base before the move
Walk back from the sharp move to the last few small candles before it. That cluster, usually one to three candles, is the base. Each base candle should be small: we used a range under 0.8x ATR. A wide, messy base gives you a zone too wide to trade with a sensible stop.
03Draw from the base high to the base low
The common convention draws the box from the highest to the lowest point of the base, wicks included. Some traders use bodies only for a tighter zone. The edge nearest current price is the near (proximal) edge, where entries go. The other is the far (distal) edge, where stops go. Pick one drawing rule and stick to it, or your test results mean nothing.
04Start on a higher timeframe
Mark zones on the 4-hour or daily chart first, then drop down to time an entry. Higher-timeframe zones carry more weight in most guides. In our data, daily first retests did a little better than 4-hour ones, 34.6% against 29.9% reaching 2R. A 5-minute zone can be irrelevant an hour later.
05Note whether the zone is fresh
A fresh zone is one price hasn't returned to yet. The usual theory is that each return uses up some of the orders sitting there, so the first retest should be the strongest. Our 3,659-zone test didn't find that: first, second and third retests performed about the same. Keep the tally by hand anyway, because it is the number you need to check the claim on your own market.
The four zone shapes
01Drop-base-rally (demand)
Price falls, pauses in a base, then rallies hard. The base becomes a demand zone. This is the reversal version, since the move into the base and the move out of it point opposite ways. In our test 30.8% of first retests reached 2R.
02Rally-base-rally (demand)
Price rallies, pauses, then rallies again. The pause becomes a demand zone inside an uptrend. This is the continuation version, and the one trend traders lean on for pullback entries. First retests reached 2R 31.9% of the time.
03Rally-base-drop (supply)
Price rallies, pauses in a base, then drops hard. The base becomes a supply zone. Reversal version again. First retests reached 2R 31.1% of the time.
04Drop-base-drop (supply)
Price drops, pauses, then drops again. The pause becomes a supply zone inside a downtrend. Continuation version. The weakest of the four in our data, at 28.6%. None of the four cleared the 33.3% a 2R trade needs to break even.
Wait for price to come back, then watch the reaction
A zone tells you where to pay attention. It doesn't tell you to click buy. The usual approach waits for price to return to a fresh zone, then looks for a reaction: a rejection wick, a strong close away from the zone, or a lower-timeframe break in your direction. Entry goes at or near the zone's near edge. The stop goes just beyond its far edge. The first target is often the nearest opposite zone, or a fixed multiple of the risk. If price closes cleanly through a zone, it's broken, and some traders flip it and watch from the other side. That happened a lot in our test: 46.8% of first retests closed through the far edge within five candles. That's why the reaction matters more than the touch. Traders Journal's Supply Demand ERS indicator marks its own zones in replay, built from swing highs and lows rather than hand-drawn bases, with a suggested entry, stop and two targets. You judge each retest one candle at a time, without seeing what comes next.
Our 3,659-zone test and real charts
Anatomy of a demand zone
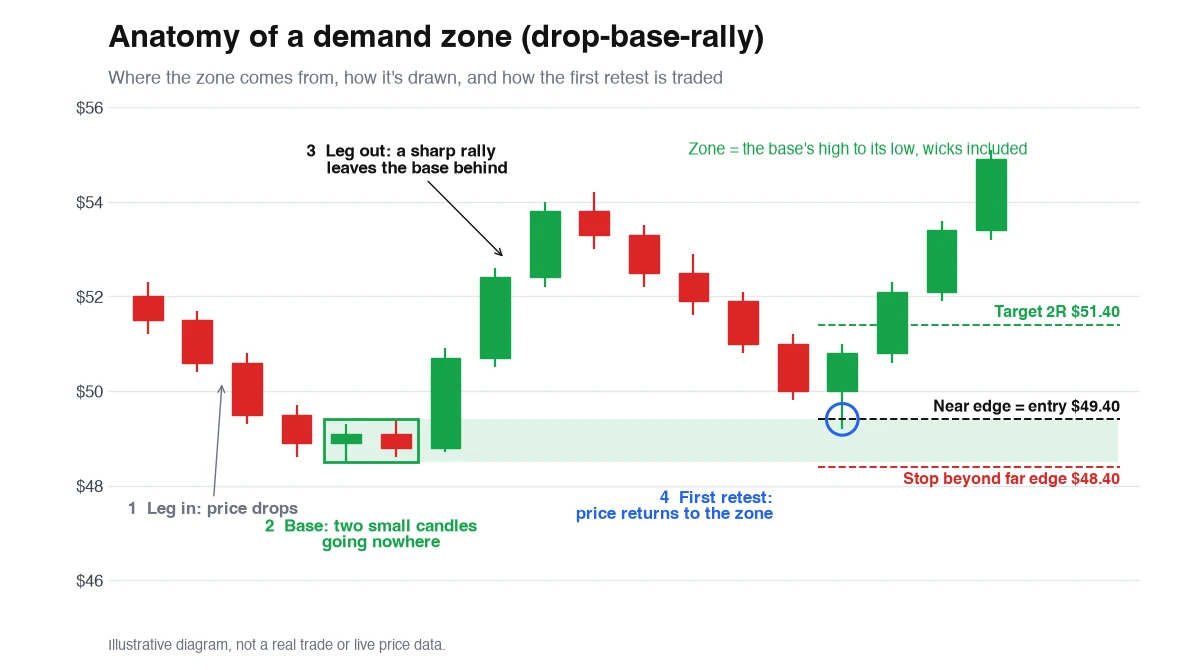
(1) Price drops into the area. (2) Two small candles go nowhere: that's the base, and the box from its high to its low is the zone. (3) A sharp rally leaves it behind. (4) Price later returns to the near edge at $49.40. Entry there, stop under the far edge at $48.40, so $1 of risk. A 2R target sits at $51.40.
The four zone shapes side by side
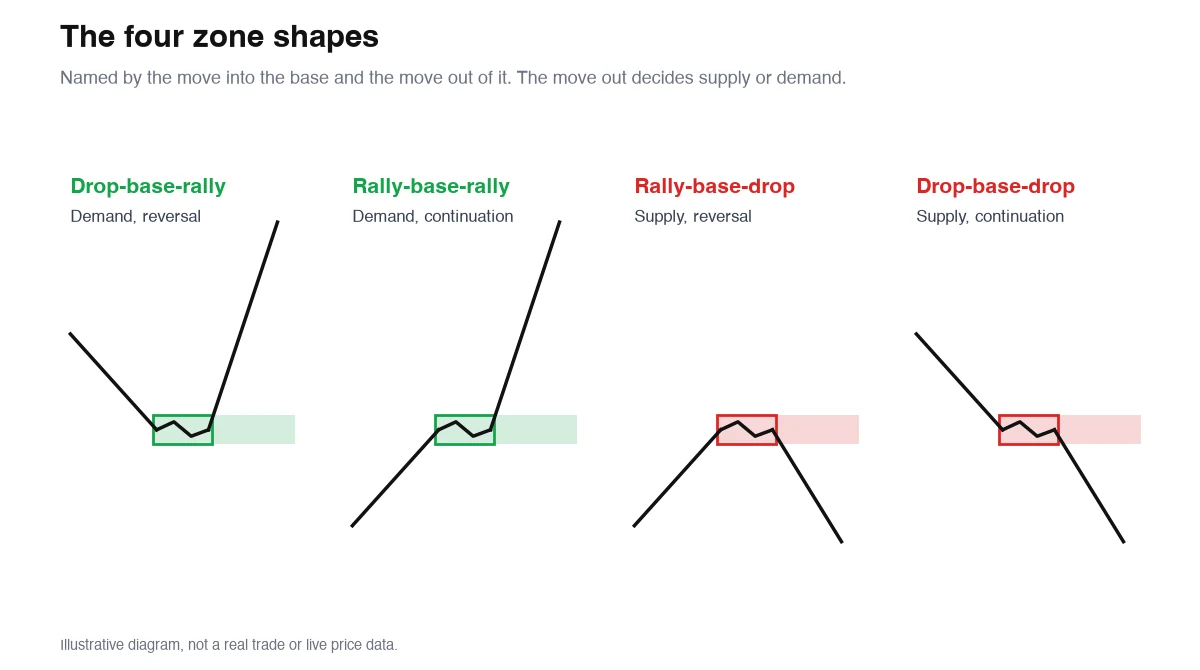
Name a zone by the move in and the move out. The move out decides what it is: up makes demand, down makes supply. The move in decides whether it's a reversal (drop-base-rally, rally-base-drop) or a continuation (rally-base-rally, drop-base-drop).
We tested 3,659 zones. Fresh ones didn't hold better.
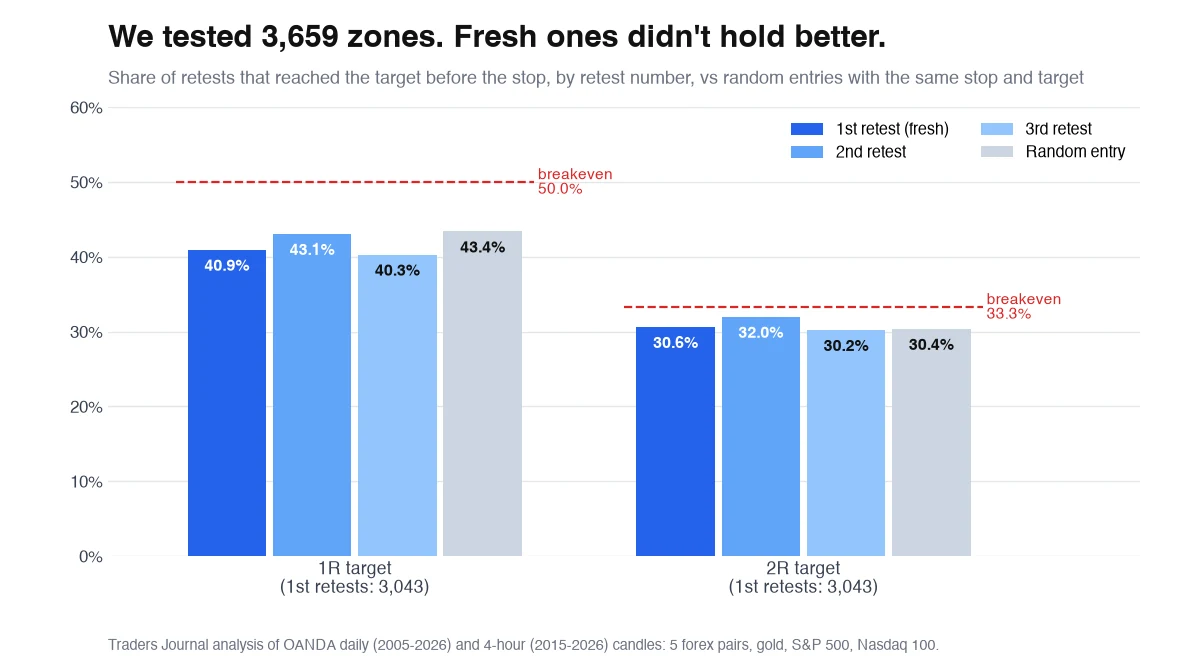
We coded the rules in this guide and ran them on eight markets from 2005 (daily) and 2015 (4-hour). That found 3,659 zones: 564 daily, 3,095 on 4-hour. Each retest was traded at the near edge with a stop just past the far edge. At a 2R target, first retests won 30.6%, second retests 32.0%, third 30.2%. Random entries with the same stop and target won 30.4%. At 1R the first retest won 40.9% against 43.4% at random. Breakeven is 33.3% at 2R and 50% at 1R. Taking every touch blindly lost money, and freshness made no measurable difference.
Shape and trend barely moved the result
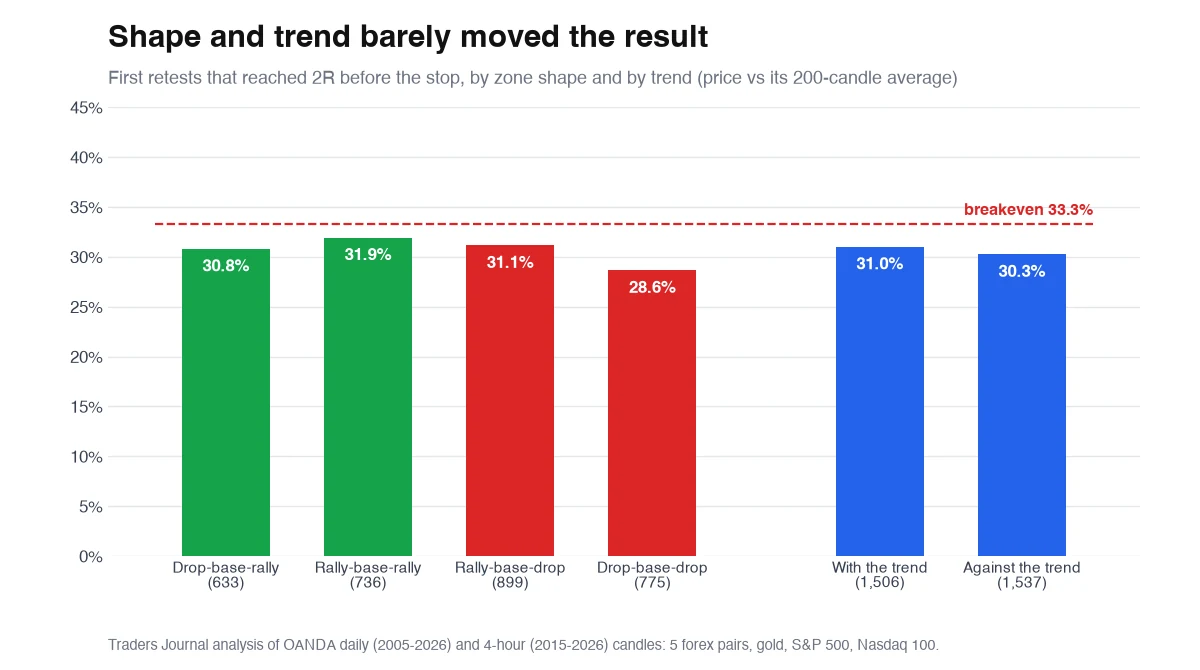
Two popular filters, tested. Zone shape: the four types landed between 28.6% and 31.9%. Trend: zones on the side of the 200-candle average (demand above it, supply below) won 31.0%. Zones against it won 30.3%. The one hint of an edge was the daily chart, where first retests reached 2R 34.6% of the time against 29.2% at random, across 457 trades. That's just above breakeven and worth testing yourself. It isn't proof.
EUR/USD, March 2026: a supply zone that held
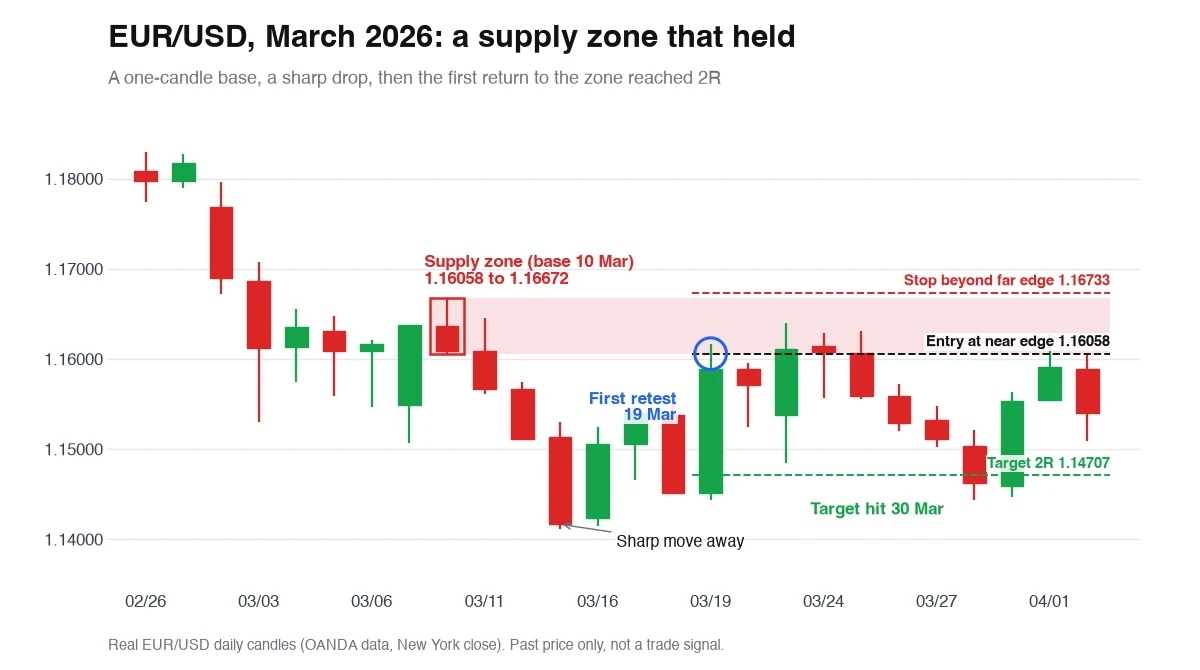
On 10 March EUR/USD printed a single small candle between 1.16058 and 1.16672. Three days later it closed at 1.14166 after a sharp drop: a rally-base-drop supply zone. On 19 March price climbed back to 1.16164, inside the zone. A short at the near edge (1.16058) with a stop above the far edge (1.16733) risks 67.5 pips. Price poked back into the zone on 23 March at 1.16399, still short of the stop, then fell. The 2R target at 1.14707 hit on 30 March.
USD/JPY, January 2026: a fresh demand zone that broke
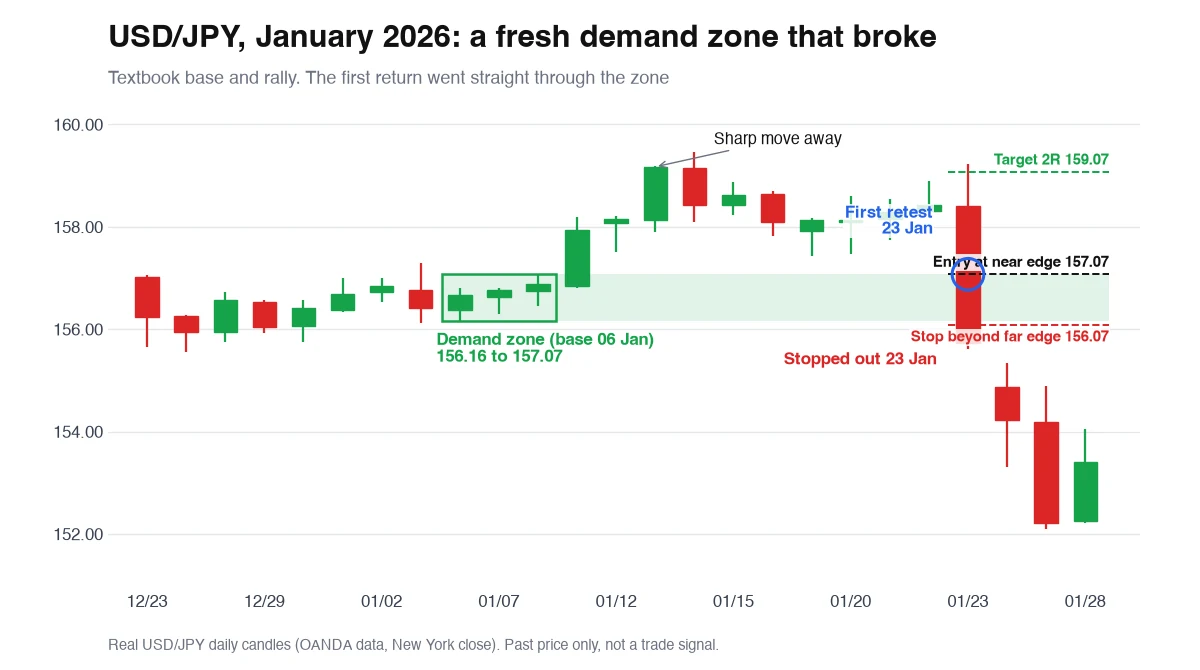
From 6 to 8 January USD/JPY sat in a tight base between 156.16 and 157.07, then closed at 159.17 on 13 January: a clean drop-base-rally demand zone, with the trend. It was still fresh on 23 January, when price opened at 158.41, briefly spiked to 159.23, then fell to 155.61 in the same day. A daily candle can't show the order. With the close near the low, the spike most likely came first, and our test counts a same-day touch of the stop as a loss either way. That single candle went through the near edge, the whole zone and the stop at 156.07, closing at 155.74. By 27 January USD/JPY was at 152.09. Same textbook setup as the EUR/USD example, opposite result. That's what our 3,659-zone count looks like one trade at a time.
Supply and demand zones vs. support, resistance and order blocks
Supply and demand zones vs support and resistance: they overlap on a chart, but they're defined differently. Order blocks sit close to zones too.
| Concept | What it marks | How it's defined | What happens after a touch |
|---|---|---|---|
| Supply / demand zone | The base before a sharp move | A small cluster of candles, drawn high to low | Theory says it weakens with each retest; our test found no difference |
| Support / resistance | A level price has turned at several times | Repeated swing highs or lows | Often treated as stronger with more touches |
| Order block | The last opposing candle before a sharp move | One candle | Similar to a zone; often treated as used up after the first revisit |
Zones mark where to look. Price decides the rest
They can't tell you which zones will hold. Plenty fail on the first touch: in our test nearly half of first retests closed straight through the zone within five candles. 'Fresh zones are stronger' is a rule of thumb traders repeat. On 3,659 zones across eight markets, first retests did no better than second or third ones, or than random entries. Zones don't give you timing either. Price may return in an hour, in a month, or never: 17% of our zones were never retested. And drawing them is subjective, so two traders can mark the same base differently, which changes every number above. A mechanical rule found no edge. A discretionary read, or a confirmation filter, might. The only way to know how yours behave is to count: mark every zone, replay each retest, and log whether it held.
Frequently asked questions
What are supply and demand zones in trading?
They are the small bases price sat in right before a sharp move. A base before a sharp rally is a demand zone. A base before a sharp drop is a supply zone. Traders watch them for a reaction when price comes back.
How do you draw supply and demand zones?
Find a sharp move, walk back to the small candles right before it, and draw a box from that base's high to its low. Start on a higher timeframe and note whether price has returned to the zone yet.
Do supply and demand zones actually work?
Not when traded mechanically, in our test. Across 3,659 zones on forex, gold and indices, first retests reached a 2R target 30.6% of the time. Random entries with the same stop and target reached 30.4%, and breakeven is 33.3%. Any edge has to come from how you filter or confirm the retest, so test that before trading it.
Are fresh supply and demand zones stronger?
That's the common claim. Our data didn't support it: first retests won 30.6% at 2R, second retests 32.0% and third retests 30.2%. The differences are within noise for samples this size.
What is the difference between supply and demand zones and support and resistance?
Support and resistance are levels price has turned at several times, and many traders see more touches as stronger. A supply or demand zone is the base before one sharp move, and each retest is usually seen as weakening it.
Where do you put the stop loss on a supply or demand zone?
Just beyond the far (distal) edge: under the zone for demand, above it for supply. We added a buffer of 10% of the zone's height. Entry goes at the near (proximal) edge, so the zone's height sets your risk.
Which timeframe is best for supply and demand zones?
Mark zones on a higher timeframe like the 4-hour or daily, then use a lower one to time entries. In our test daily first retests did slightly better than 4-hour ones (34.6% vs 29.9% at 2R). Very low-timeframe zones go stale fast.
Why do supply and demand zones fail?
The orders behind the original move may already be used up, the zone may sit against the bigger trend, or it may simply be drawn too wide. In our test 46.8% of first retests closed through the far edge within five candles.
Is a supply and demand zone the same as an order block?
They are close cousins. An order block is one candle: the last opposing candle before a sharp move. A supply or demand zone is the whole small base before the move, which may be one candle or several.
How many supply and demand zones should be on a chart?
Few. Keep the nearest fresh zone above price and the nearest fresh zone below it on your main timeframe. A chart covered in boxes looks thorough and tells you nothing. If every price is a zone, none of them is.